
DSCI 554 lecture 4
Designing infographics and dashboards, D3 data join basics and loading data
Dr. Luciano Nocera

Outline
- Designing infographics and dashboards
- Function and esthetics, minimalistic visualizations
- D3 data join basics
- Loading data in D3
Understand
- Information to communicate
- User capabilities, knowledge of topic, context and display size
Find soft spot
by achieving balance
- Seek depth:
First use the space to help users understand the data, then decorate with a purpose!
Beauty is not the goal of visualization and it is usually not required to achieve the goal… remember that the goal is to enlighten.
Do not underestimate users and cater to the least common denominator: not all readers are equal!
- Clarify:
create graphics that do not simplify but clarify
- Add Boom effect:
add appropriate Boom effect with artistry to attract the reader.
I want my readers to flip the page and, boom! The infographic shows up as an explosion! -- Luiz Iria
Understand
- Information to communicate
- User capabilities, knowledge of topic, context and display size
Do
- Use a grid layout
- Most important at the top
- Use annotated & labeled big numbers
- Simplify
- Optimize visual queries
- Use safe fonts, colors consistently
- 5-second rule: topic, key trends, how to explore (monitoring applications!)
1. Seek depth
Cairo's recommendations
- Define where your graphic stands in terms of density and dimensionality
- Move position of graphic at least 10% towards density and multidimensionality
- Organize in layers, starting with a summary
- Include inner layers as necessary based on story and focus
- Structure the layers in logical order
Dashboard recommendations
- Use a grid layout
- Most important at the top
- Use annotated & labeled big numbers
- 5-second rule: topic, key trends, how to explore (monitoring applications!)
2. Clarify
Cairo's recommendations
- Do not simplify but clarify
- Think about structure first then eye-candy
- Use space first to explain and develop the story
- Think about how data should be organized before thinking about style
- Never dumb down your data
Dashboard recommendations
- Simplify
- Optimize visual queries
- 5-second rule: topic, key trends, how to explore (monitoring applications!)
3. Boom effect
Cairo's recommendations
- Experiment (carefully) with novel (original) forms
- The more original the form the more redundancy
- Explain novel forms with text and other graphics
Dashboard recommendations
- Use safe fonts and colors consistently
- 5-second rule: topic, key trends, how to explore (monitoring applications!)
Outline
- Designing infographics and dashboards
- Function and esthetics, minimalistic visualizations
- D3 data join basics
- Loading data in D3
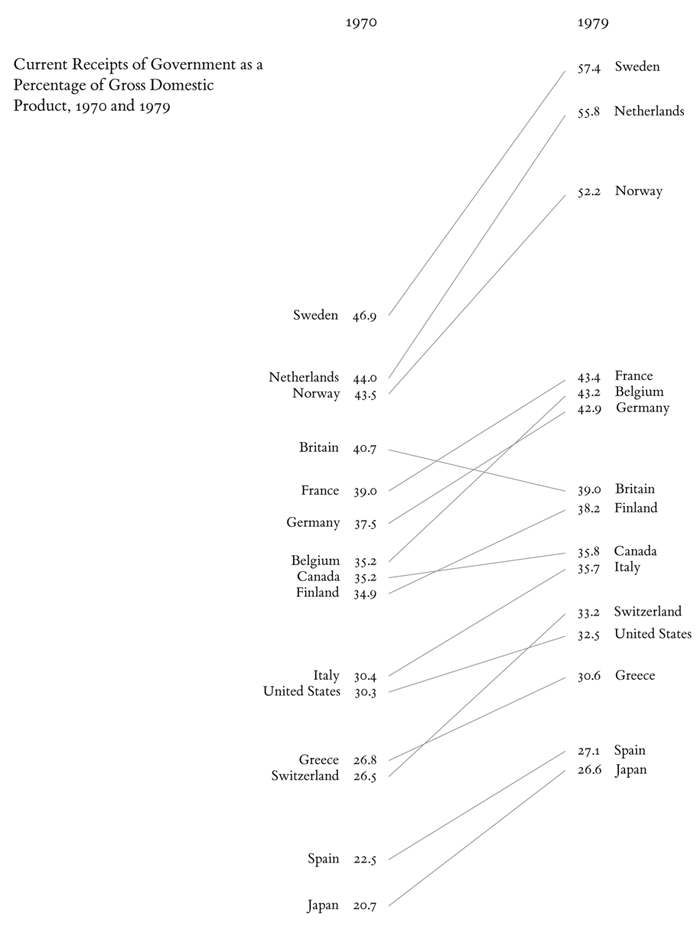
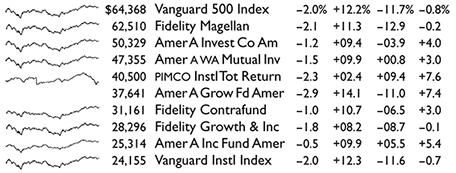
Tufte's design principle
Elegance in visuals is attained when the complexity of the data matches the simplicity of the design
Data-ink ratio
\begin{align*}
\text{Data-ink ratio}
&= \frac{\text{Data-ink}}{\text{Total ink used to print the graphic}} \\
&= \text{Proportion of a graphic’s ink devoted to the non-redundant display of data-information} \\
&= 1.0 − \text{Proportion of a graphic that can be erased without loss of data-information}
\end{align*}
Tufte's design principles
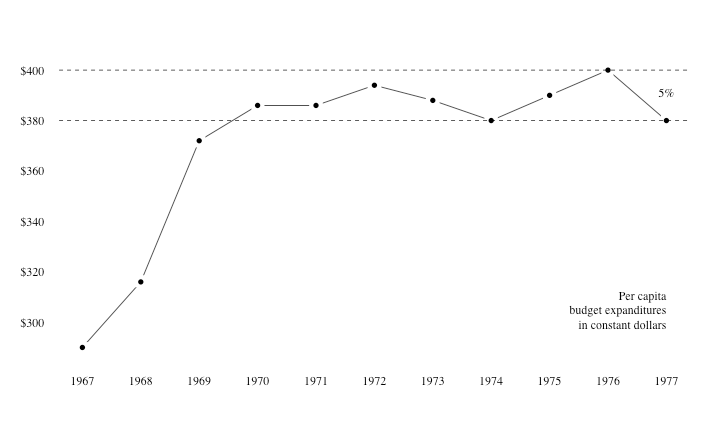
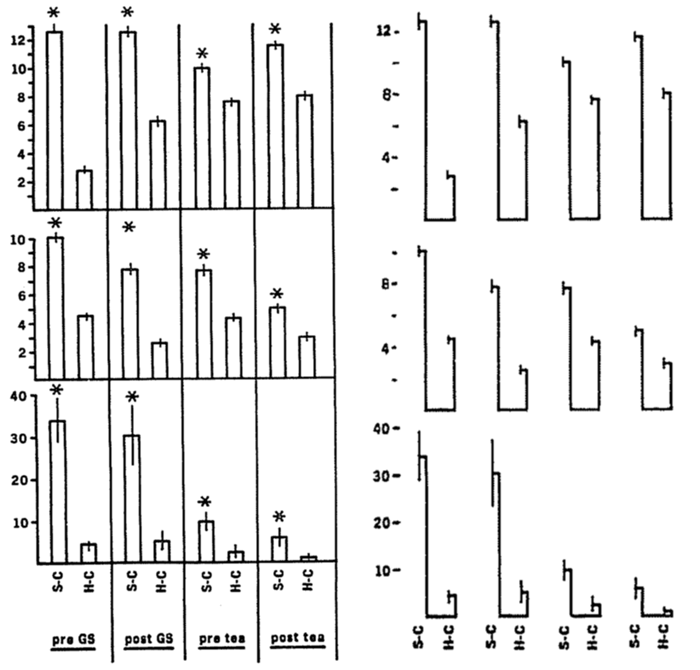
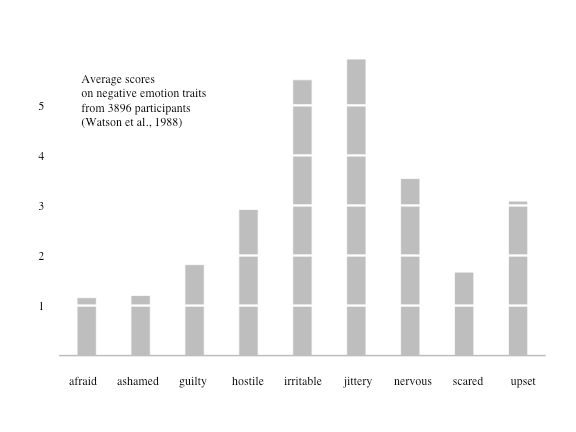
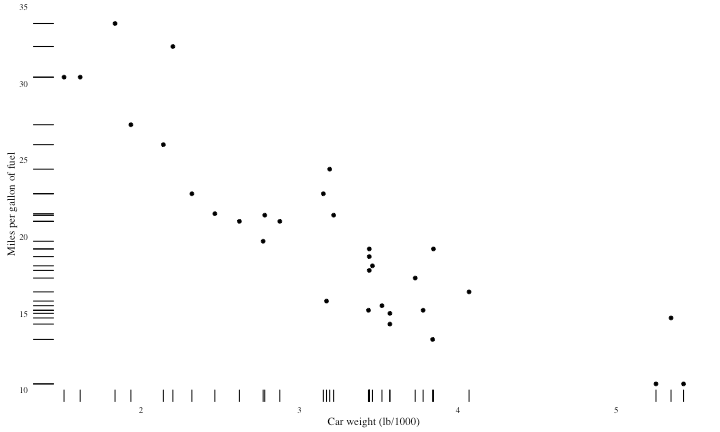
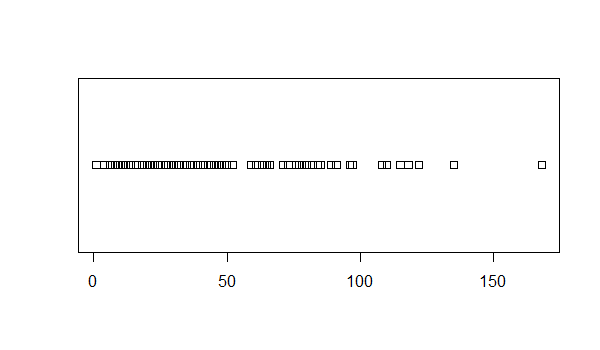
- Above all else show data
- Maximize the data-ink ratio
- Erase non-data-ink
- Erase redundant data-ink
- Revise and edit

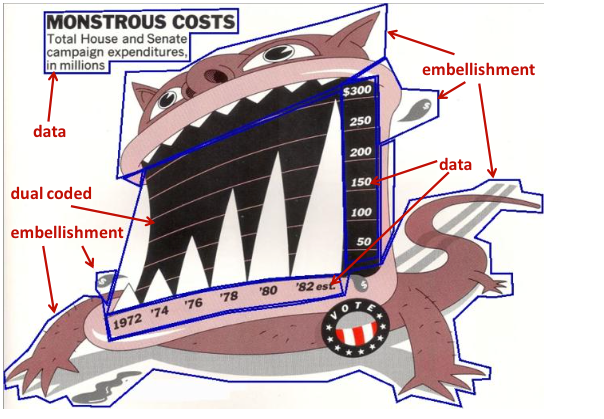
Chartjunk
The interior decoration of graphics generates a lot of ink that does not tell the viewer anything new.
The purpose of decoration varies — to make the graphic appear more scientific and precise, to enliven the display, to give the designer an opportunity to exercise artistic skills.
Regardless of its cause, it is all non-data-ink or redundant data-ink, and it is often chartjunk.
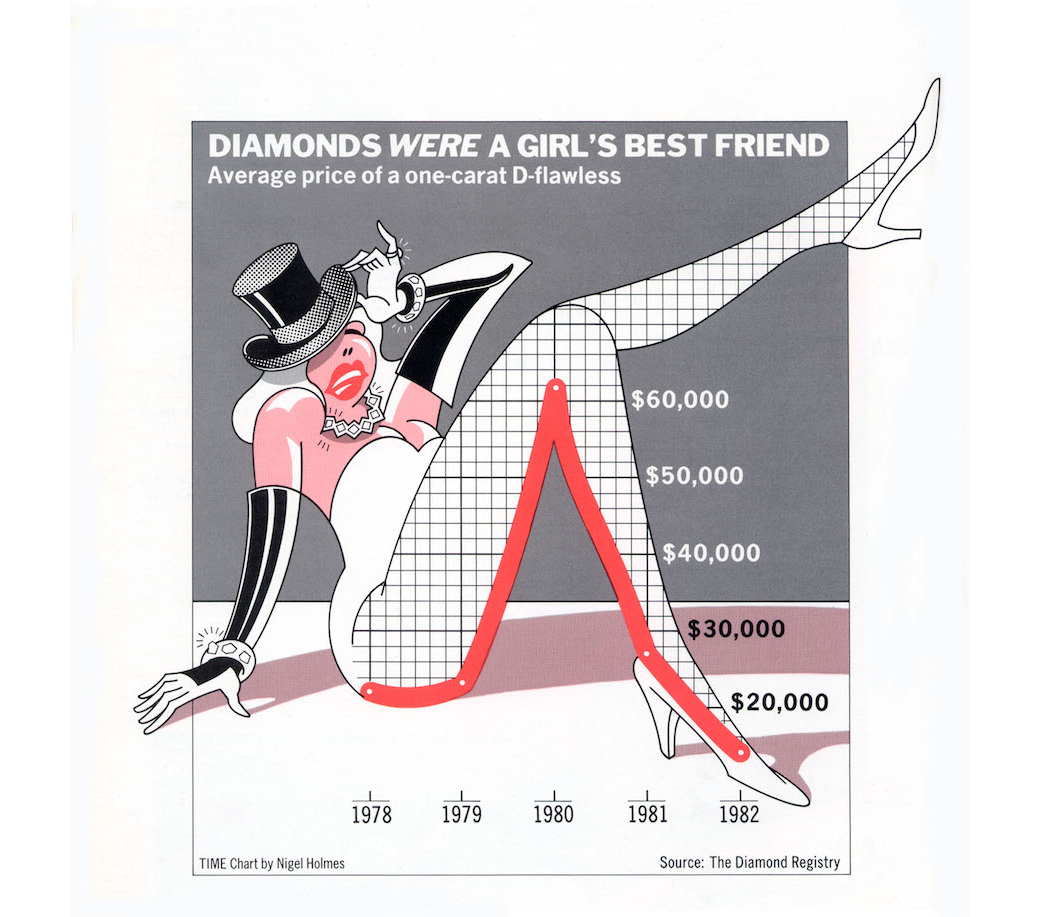
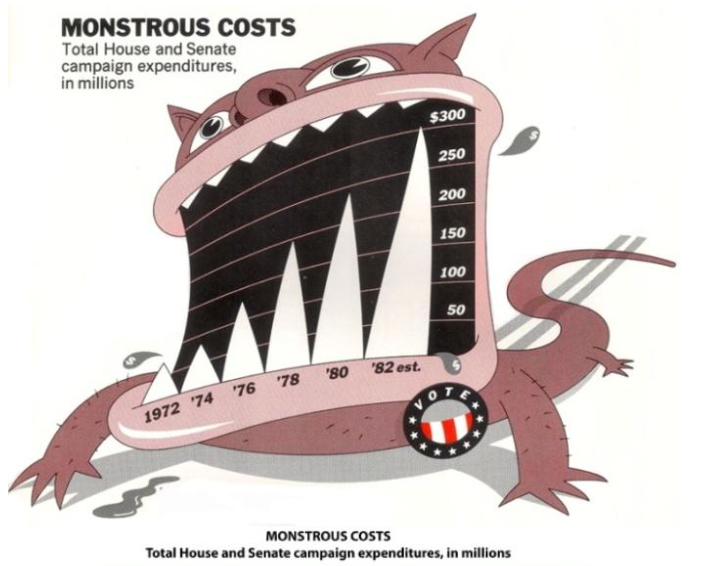
Nigel Holmes's design principles
Use humor to instill affection in readers for numbers and charts
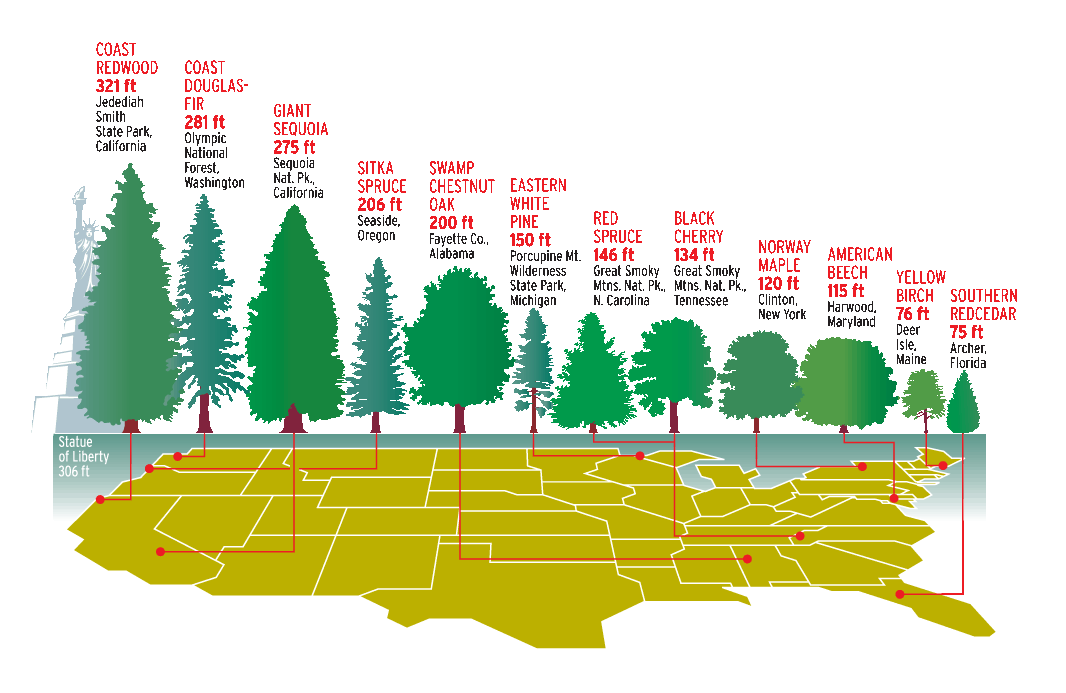
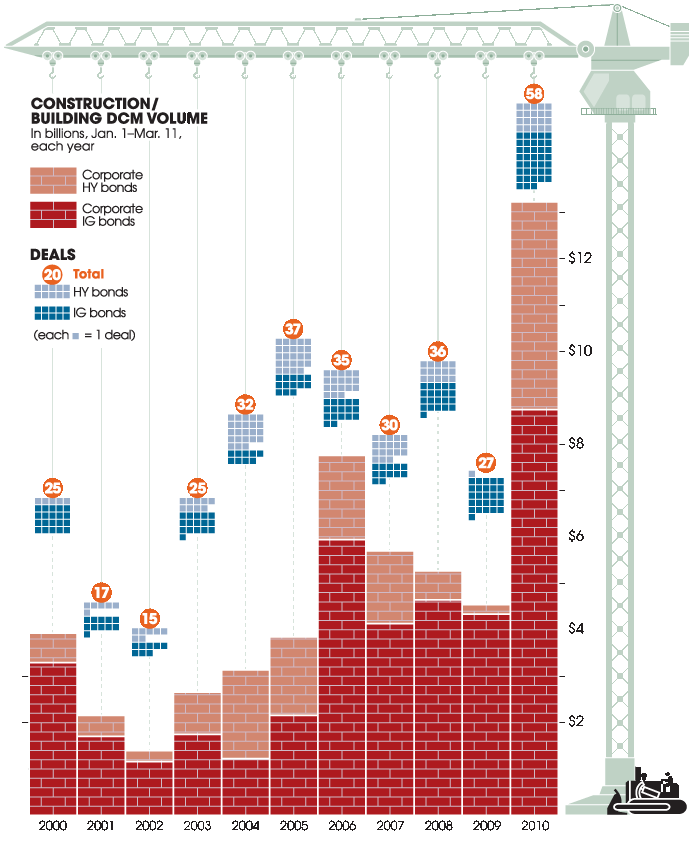
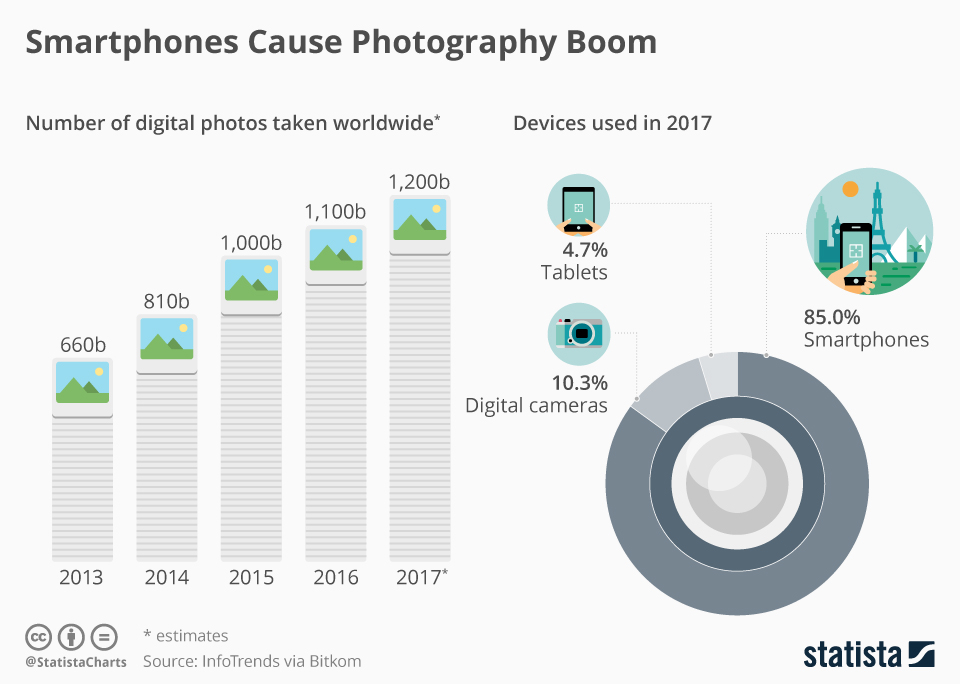

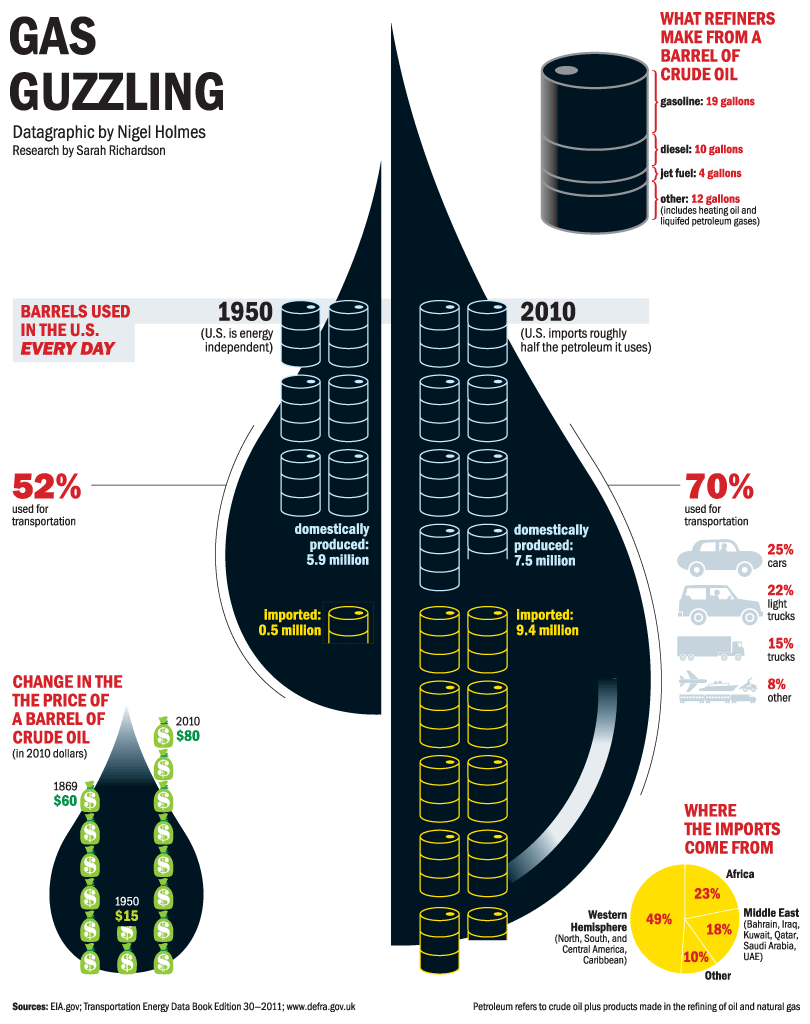
Useful junk? [Bateman 2010]
Holmes
Standard
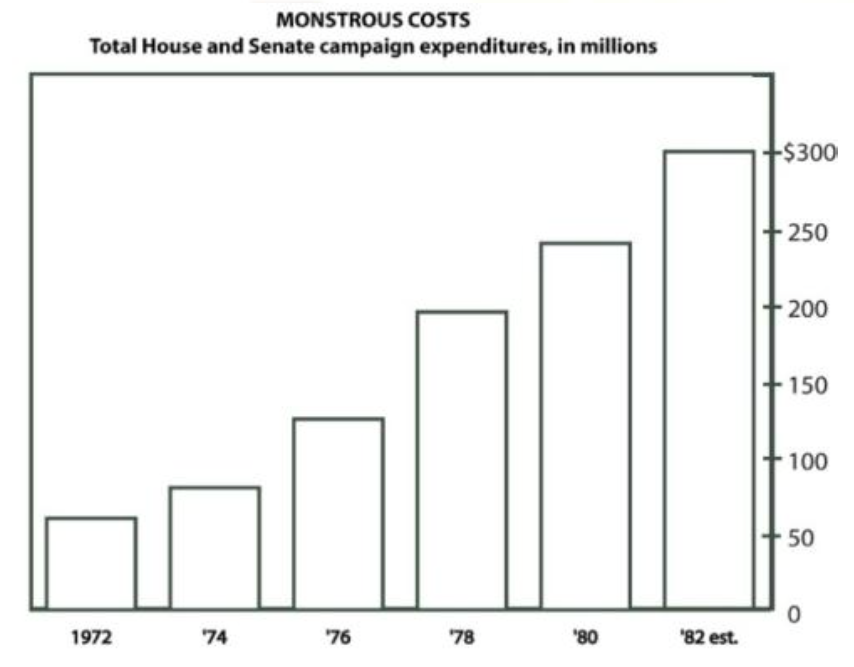
ACM Conference on Human Factors in Computing Systems, Atlanta, GA, USA. 2010.
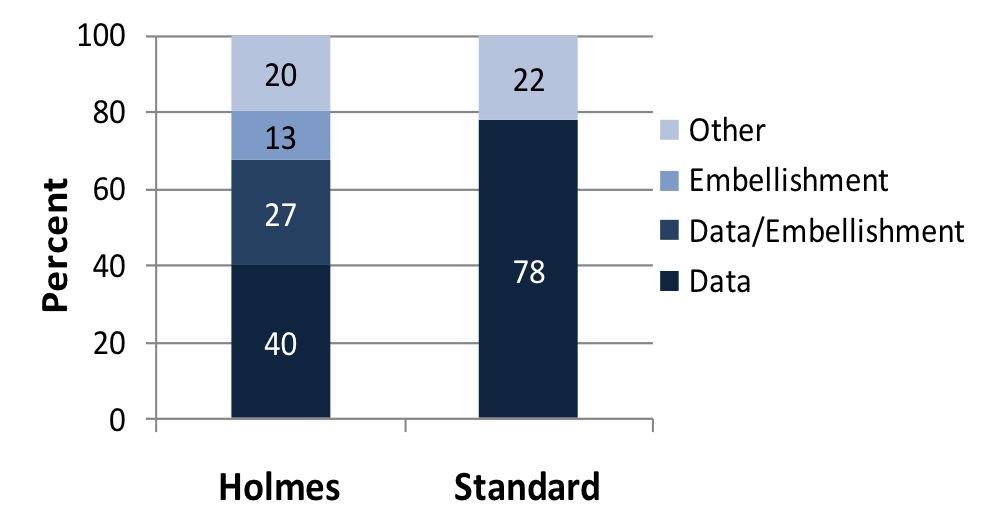
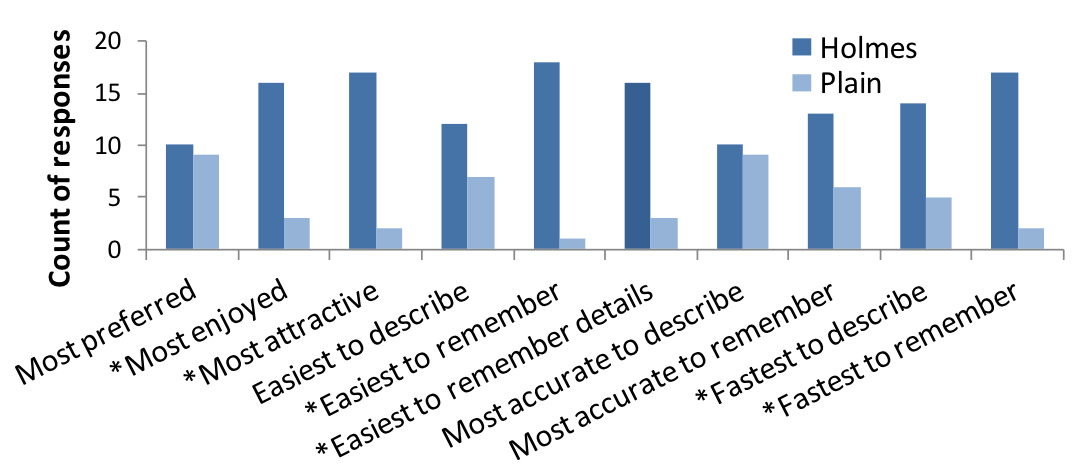
No difference:
- Interactive interpretation & accuracy
- Recall accuracy after a five-minute gap
Different:
- Readers value messages in Holmes charts more often than in plain
Outline
- Function and esthetics, minimalistic visualizations
- D3 data join basics
- Stress test
- Customize the selection
- Loading data in D3
| Javascript | Initial DOM | Final DOM |
|---|---|---|
|
[Blank Page]
|
|
| Javascript | Initial DOM | Final DOM |
|---|---|---|
|
[Blank Page]
|
[Blank Page]
|
| Javascript | Initial DOM | Final DOM |
|---|---|---|
|
A B |
A B 15 |
| Javascript | Initial DOM | Final DOM |
|---|---|---|
|
A B |
A B |
| Javascript | Initial DOM | Final DOM |
|---|---|---|
|
A B |
A B 5 10 15 |
Outline
- Function and esthetics, minimalistic visualizations
- D3 data join basics
- Stress test
- Customize the selection
- Multiple elements per data point
- Loading data in D3
Customize the selection
HTML elements
.attr()to set attributes, e.g.,class.style()to set style parameters.text()to set inner text
SVG elements
.attr()to place and size, e.g.,x,width.style()to configure and update appearance
Outline
- Function and esthetics, minimalistic visualizations
- D3 data join basics
- Stress test
- Customize the selection
- Multiple elements per data point
- Loading data in D3
Selecting configuring the parent
Selecting
							var el = d3.select('body')  //select body

							var el = d3.select('#div0')  //select div with id div0

							var el = d3.select('#svg0')  //select svg with id svg0
Sizing SVG
Statically
<svg id='svg0' width='300' height='100'></svg>
							var svg = d3.select('body')
							  .append('svg')
							  .attr('width', '300')
							  .attr('height', '100');
Outline
- Function and esthetics, minimalistic visualizations
- D3 data join basics
- Stress test
- Customize the selection
- Multiple elements per data point
- Loading data in D3
Problem: Multiple elements per data point
				<svg width="60px" height="60px" style="background-color: lightgrey">
				  <!-- First data point -->

				  1

				  <!-- Second data point -->

				  2

				  <!-- Third data point -->

				  3
				</svg>
⚠️ D3 bars data join (the wrong way)
					<body>
					<svg width="60px" height="60px" style="background-color: lightgrey" id="chart1"></svg>
					<script>
					var dataset = [{name: '1', color: 'red', width: 20, height: 20},
					               {name: '2', color: 'green', width: 20, height: 40},
					               {name: '3', color: 'blue', width: 20, height: 60}];

					d3.select('#chart1')
					  .selectAll('rect')
					  .data(dataset)
					  .enter()

					  .append('rect')
					  .attr('x', function (d, i) { return i * d.width; })
					  .attr('y', function (d) { return 60 - d.height; })
					  .attr('width', function (d) { return d.width; })
					  .attr('height', function (d) { return d.height; })
					  .attr('fill', function (d) { return d.color;})

					  .append('text')  // NOT SEEN!
					  .attr('x', function (d, i) { return i * d.width; })
					  .attr('y', function (d) { return 60; })
					  .attr('font-size', '18px')
					  .attr('fill', 'white')
					  .text(function (d) { return d.name; })
					</script>
					</body>
👍 D3 bars data join (2 data joins)
					<body>
					<svg width="60px" height="60px" style="background-color: lightgrey" id="chart2"></svg>
					<script>
					var dataset = [{name: '1', color: 'red', width: 20, height: 20},
					               {name: '2', color: 'green', width: 20, height: 40},
					               {name: '3', color: 'blue', width: 20, height: 60}];

					var svg = d3.select('#chart2');

					svg.selectAll('rect')
					  .data(dataset)
					  .enter()
					  .append('rect')
					  .attr('x', function (d, i) { return i * d.width; })
					  .attr('y', function (d) { return 60 - d.height; })
					  .attr('width', function (d) { return d.width; })
					  .attr('height', function (d) { return d.height; })
					  .attr('fill', function (d) { return d.color;});

					svg.selectAll('text')
					  .data(dataset)
					  .enter()
					  .append('text')
					  .attr('x', function (d, i) { return i * d.width; })
					  .attr('y', function (d) { return 60; })
					  .attr('font-size', '18px')
					  .attr('fill', 'white')
					  .text(function (d) { return d.name; })
					</script>
					</body>
👍 D3 bars data join (enter selection)
					<body>
					<svg width="60px" height="60px" style="background-color: lightgrey" id="chart2"></svg>
					<script>
					var dataset = [{name: '1', color: 'red', width: 20, height: 20},
					               {name: '2', color: 'green', width: 20, height: 40},
					               {name: '3', color: 'blue', width: 20, height: 60}];

					var enter_selection = d3.select('#chart2')
					  .selectAll('rect')
					  .data(dataset)
					  .enter();

					enter_selection.append('rect')
					  .attr('x', function (d, i) { return i * d.width; })
					  .attr('y', function (d) { return 60 - d.height; })
					  .attr('width', function (d) { return d.width; })
					  .attr('height', function (d) { return d.height; })
					  .attr('fill', function (d) { return d.color;});

					enter_selection.append('text')
					  .attr('x', function (d, i) { return i * d.width; })
					  .attr('y', function (d) { return 60; })
					  .attr('font-size', '18px')
					  .attr('fill', 'white')
					  .text(function (d) { return d.name; })
					</script>
					</body>
Outline
- Function and esthetics, minimalistic visualizations
- D3 data join basics
- Stress test
- Customize the selection
- Multiple elements per data point
- Loading data in D3
Loading data in D3
- Browsers cannot access or load local data (security)!
- Browsers can load data files by issuing an http request to a server
- Asynchronous process:
- AJAX calls
- d3.csv(), d3.json() (callbacks up to v3, now promises)
- Depending on the format Javascript dynamic typing not sufficient
ES6 Promises
A promise allows to associate handlers with asynchronous actions
					let myFirstPromise = new Promise((resolve, reject) => {
					  // We call resolve(...) when what we were doing asynchronously was successful, and reject(...) when it failed.
					  // In this example, we use setTimeout(...) to simulate async code.
					  setTimeout( function() {
					    resolve("Success!")  // Yay! Everything went well!
					  }, 250)
					})

					myFirstPromise.then((successMessage) => {
					  // successMessage is whatever we passed in the resolve(...) function above.
					  // It doesn't have to be a string, but if it is only a succeed message, it probably will be.
					  console.log("Yay! " + successMessage)
					});
Loading CSV files
					$ cat > cars.csv
					Year,Make,Model,Length
					1997,Ford,E350,2.34
					2000,Mercury,Cougar,2.38
					d3.csv("cars.csv").then(function (data) {
					  console.log(data);
					});
					[{Year: "1997", Make: "Ford", Model: "E350", Length: "2.34"},
					 {Year: "2000", Make: "Mercury", Model: "Cougar", Length: "2.38"}]
Converting to numbers
parseInt() and parseFloat()
				parseInt('10');  //int 10
				parseFloat('10.1');  //float 10.1
Coercion with
A lightning talk by Gary Bernhardt from CodeMash 2012
json.org Introducing JSON
d3 API: d3-fetch d3.json(input[, init])
What will appear on the page?
data.csv
unary + operator(faster)
				+''  //int 0
				+'1'  //int 1
				+'1.1'  //float 1.1
JSON format
- Stands for Javascript object notation
- Text format
- Data is represented as a Javascript object
- Keys must be quoted (strings)
				[
				  {"year": 1997, "make": "Ford", "model": "E350", "length": 2.34},
				  {"year": 2000, "make": "Mercury", "model": "Cougar", "length": 2.38}
				]
Loading JSON files
				$ cat > cars.json
				[{"year": 1997, "make": "Ford", "model": "E350", "length": 2.34},
				 {"year": 2000, "make": "Mercury", "model": "Cougar", "length": 2.38}]
					d3.json("cars.json").then(function (data) {

					  console.log(data);

					  //prints to the console
					  //[{year: 1997, make: "Ford", model: "E350", length: 2.34},
					  // {year: 2000, make: "Mercury", model: "Cougar", length: 2.38}]
					});
				Color
				Red
				Green
				Blue
					<p>Orange</p>
					<script>
					d3.csv("data.csv").then(function(data) {
					  d3.select("body")
					    .selectAll("p")
					    .data(data)
					    .enter()
					    .append("p")
					    .text(function(d) {return d.Color; })
					});
					</script>
- Orange, Color, Red, Green, Blue on separate lines
- Orange, Green, Blue on separate lines←
- Color, Red, Green, Blue on separate lines
- Red, Green, Blue on separate lines