
DSCI 554 lecture 7
Colors, colors in D3, complex D3 charts
Dr. Luciano Nocera

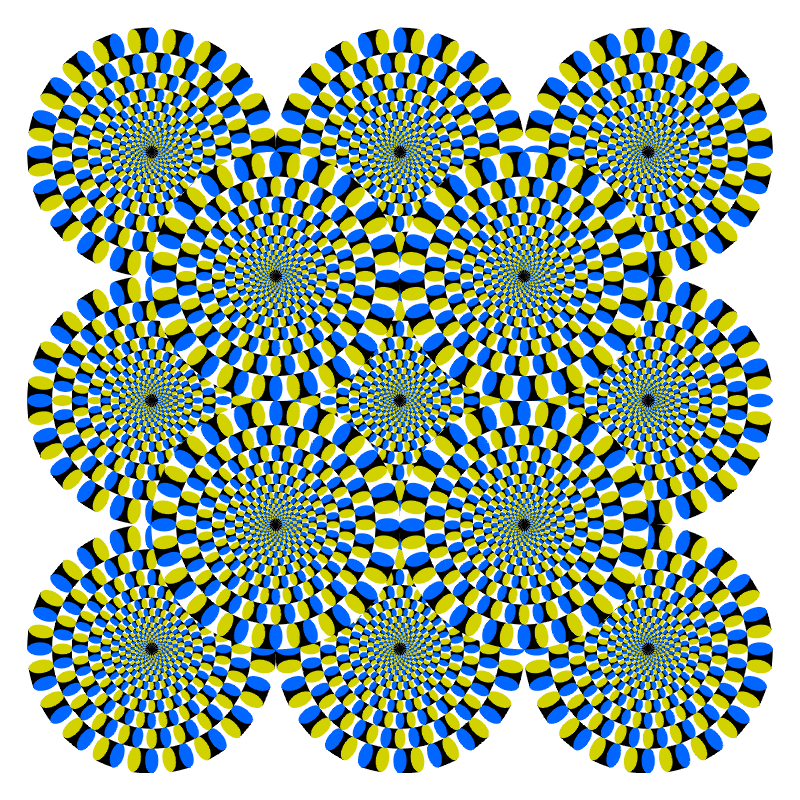
Outline
- Color perception
- Color theory
- Color design
- Colors in D3
- Complex D3 charts
What do we mean by color
Color is the perception of a kind of light
Color properties distinguishable by the eye
Hue  |
Degree to which a stimulus can be described as similar to or different from stimuli that are described as red, orange, yellow, green, blue, and purple. |
|---|---|
Saturation  |
Also called colorfulness, chroma, intensity, purity. It is the perceived intensity (chromatic strength) of a hue. |
Brightness  |
Attribute of a visual sensation according to which an area appears to emit more or less light. |
Color vision
Color vision is the ability to discriminate light composed of different wavelengths
Two Color Vision Theories:
- Trichromatic theory (Young-Helmholtz) [Young 1802]
- Opponent process theory [Hering 1878]
Trichromatic vision
- Humans are routinely trichromatic*
- Trichromacy through 3 color photoreceptors (cone cells)
- We distinguish ~10 million different colors
Trichromatic theory
Eye has 3 kinds of color receptors roughly corresponding to blue, green and red
B⇆
S
G⇆
M
R⇆
L
Problems with the Trichromatic theory
| Some colors are not seen |
|
| Photoreceptor distribution does not relate to perceived colors | 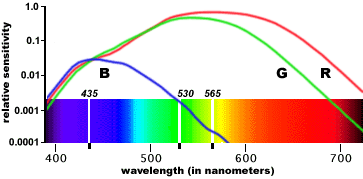 |
|
| Afterimages cannot be explained |
|
Opponent Process Theory
The visual system responds to opponent channels
The visual system records differences between the responses of cones, rather than each type of cone's individual response
| Chromatic channel | red | vs. | green |
| Chromatic channel | blue | vs. | yellow |
| Achromatic channel | black | vs. | white |
Trichromatic and Opponent Process Stages
Color perception
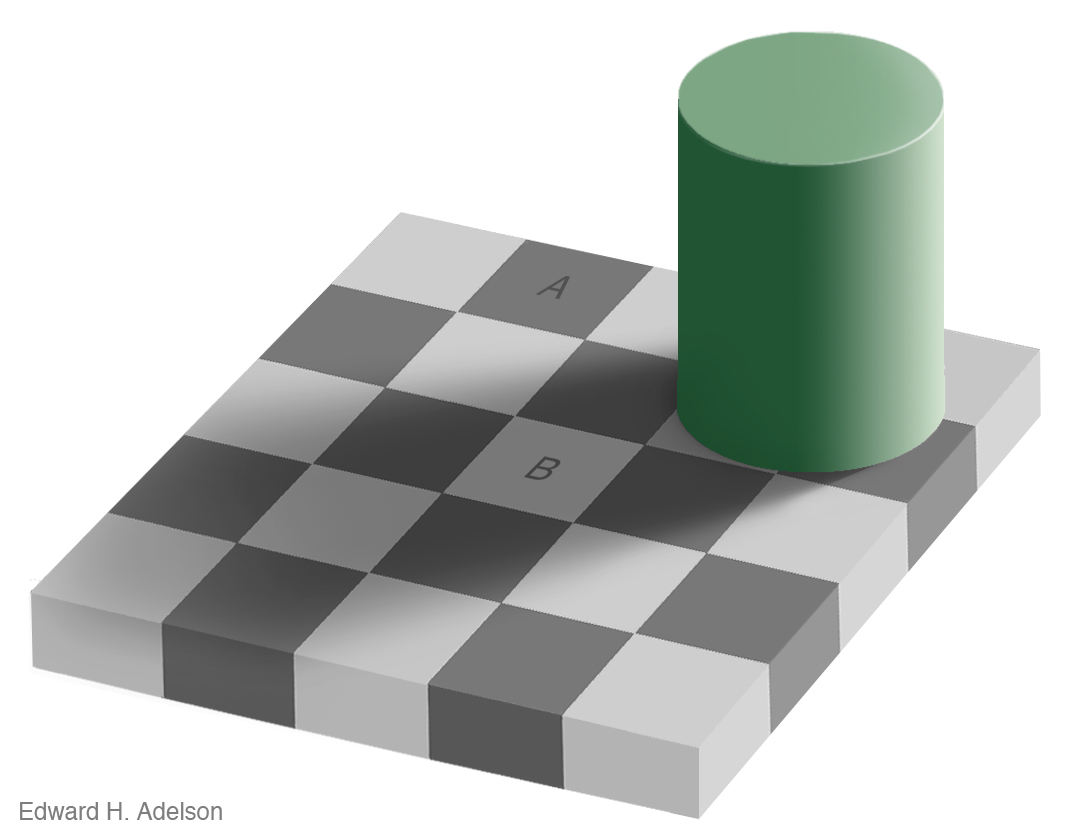
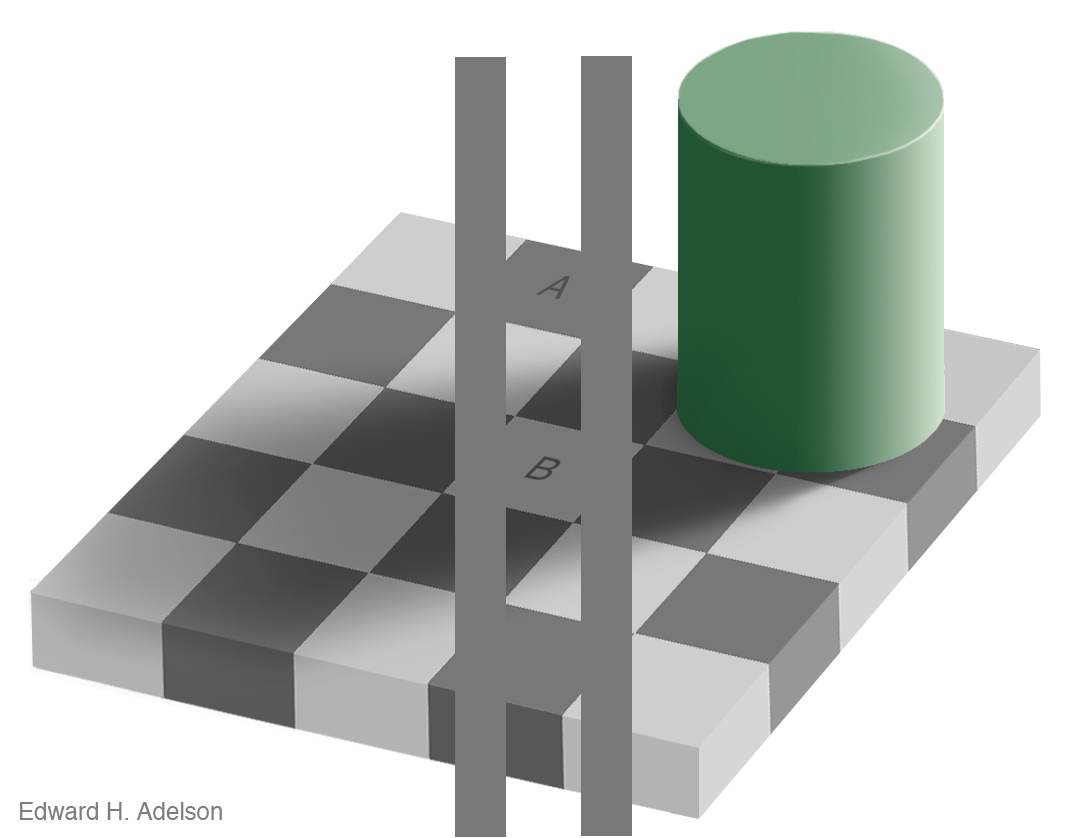
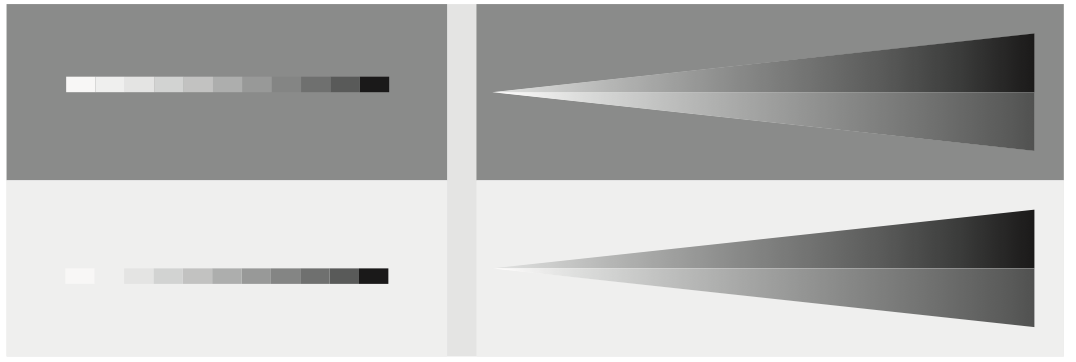
Mach bands illusion (1865)

Opponent cells
Single opponent
- [Wiesel, Hubel 1966] discovers single opponent cells
- [De Valois 1965] existence of color opponent neurons in the primate visual system
Double opponent
- [Daw 1967] evidence that color constancy is supported by double-opponent cells in V1
- Double opponent cells have a large receptive field than single-opponent cells
Lateral inhibition
- Left: light background causes greater inhibition at the center making the gray surface appear darker
- Right: dark background causes smaller inhibition at the center making the gray surface appear lighter
Simultaneous contrast (universal)
Colors of different objects affect each other

Color constancy (universal)
- Color perception to ensure colors remain constant under varying illumination
- Helps identify objects at different times of the day and lighting

Vision deficiencies (individual)
Blurred vision
Some text that is difficult to read for people with poor vision
Color blindness
As someone with protanomaly, I can see all colors, including red, it's just that red is noticeably weak and so it looks very dark to me. I often can't read black writing on a red background (or vice versa) and sometimes mistake purple with blue.
As someone with protanomaly, I can see all colors, including red, it's just that red is noticeably weak and so it looks very dark to me. I often can't read black writing on a red background (or vice versa) and sometimes mistake purple with blue.
Color blindness: affects ~9% of the population
| Normal vision | All colors in visible spectrum |  |
| Deuteranopia Deuteranomaly |
Green, M cone M: $6.2\%$ F: $0.36\%$ |
 |
| Protanopia Protanomaly |
Red, L cone M: $2.6\%$ F: $0.04\%$ |
 |
| Tritanopia Tritanomaly |
Blue, S cone M: $0.01\%$ F: $0.03\%$ |
 |
Outline
- Color perception
- Color theory
- Color design
- Colors in D3
- Complex D3 charts
Color theory
Practical guidance to color mixing and the visual effects of color combinations
Color model
Abstract mathematical model describing the way colors can be represented as tuples
HTML (SVG) color model
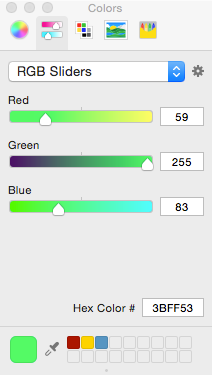
Colors encoded as tuples: (red, green, blue, opacity)
8 bits per channel, i.e., 256x256x256 (~16.7M) colors
Encodings:
- Decimal/Real: color as integer number ∈ [0, 255], opacity as real number ∈ [0, 1], 0 ≡ transparent, 1 ≡ opaque
- Hexadecimal: color and opacity as hex* number ∈ [00-FF], 00 ≡ transparent, FF ≡ opaque
name
<div style="background-color: red">name</div> <!-- named colors: red ≡ (255, 0, 0) -->
rgba
<div style="background-color: rgba(255, 0, 0, 0.3);">rgba</div> <!-- rgb(,,) or rgba(,,,) -->
hex
						<!-- opacity = 55 → 85, 85/255 = 0.333 -->
						<div style="background-color: #ff000055;">hex</div> <!-- #rgb or #rgba -->
Additive color model
Secondary colors: CMY
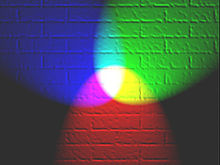
Subtractive color model
Secondary colors: RGB

Primary, secondary and complementary colors
|
Primaries
Mixed create all other colors
Cannot be mixed from other colors
|
3 primary colors
|
|
Secondary
|
3 secondary colors
mixed from 2 primaries |
|
Complementary
|
|
Additive color model techniques
| Addition of illumination | Projected colors overlap, e.g., stage projectors |
|---|---|
| Partitive mixing | Closely spaced colored dots, colors are next to each other, e.g., LCD screens |
| Time mixing | OLED micro displays, rotating color wheels, sequential illumination |
| Binocular mixing | Different colors on each eye, mixed by the brain |
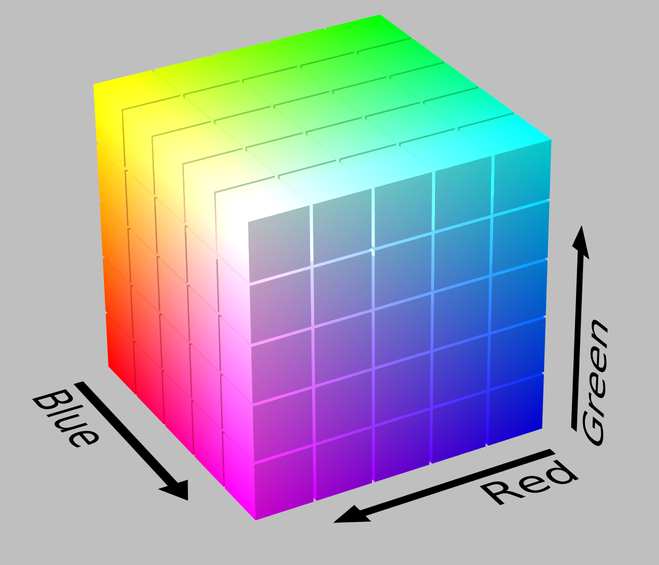
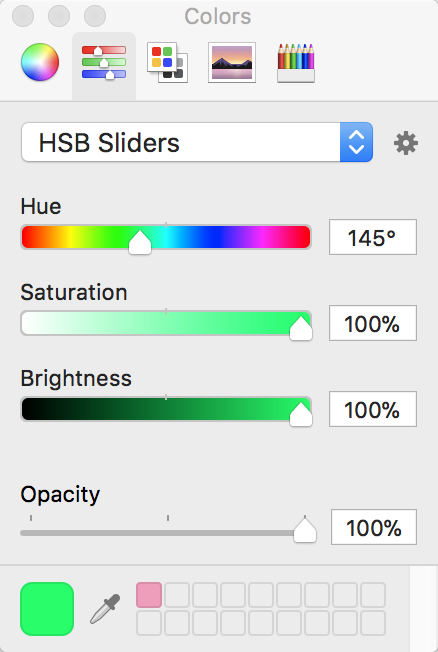
RGB colors arranged in a cube
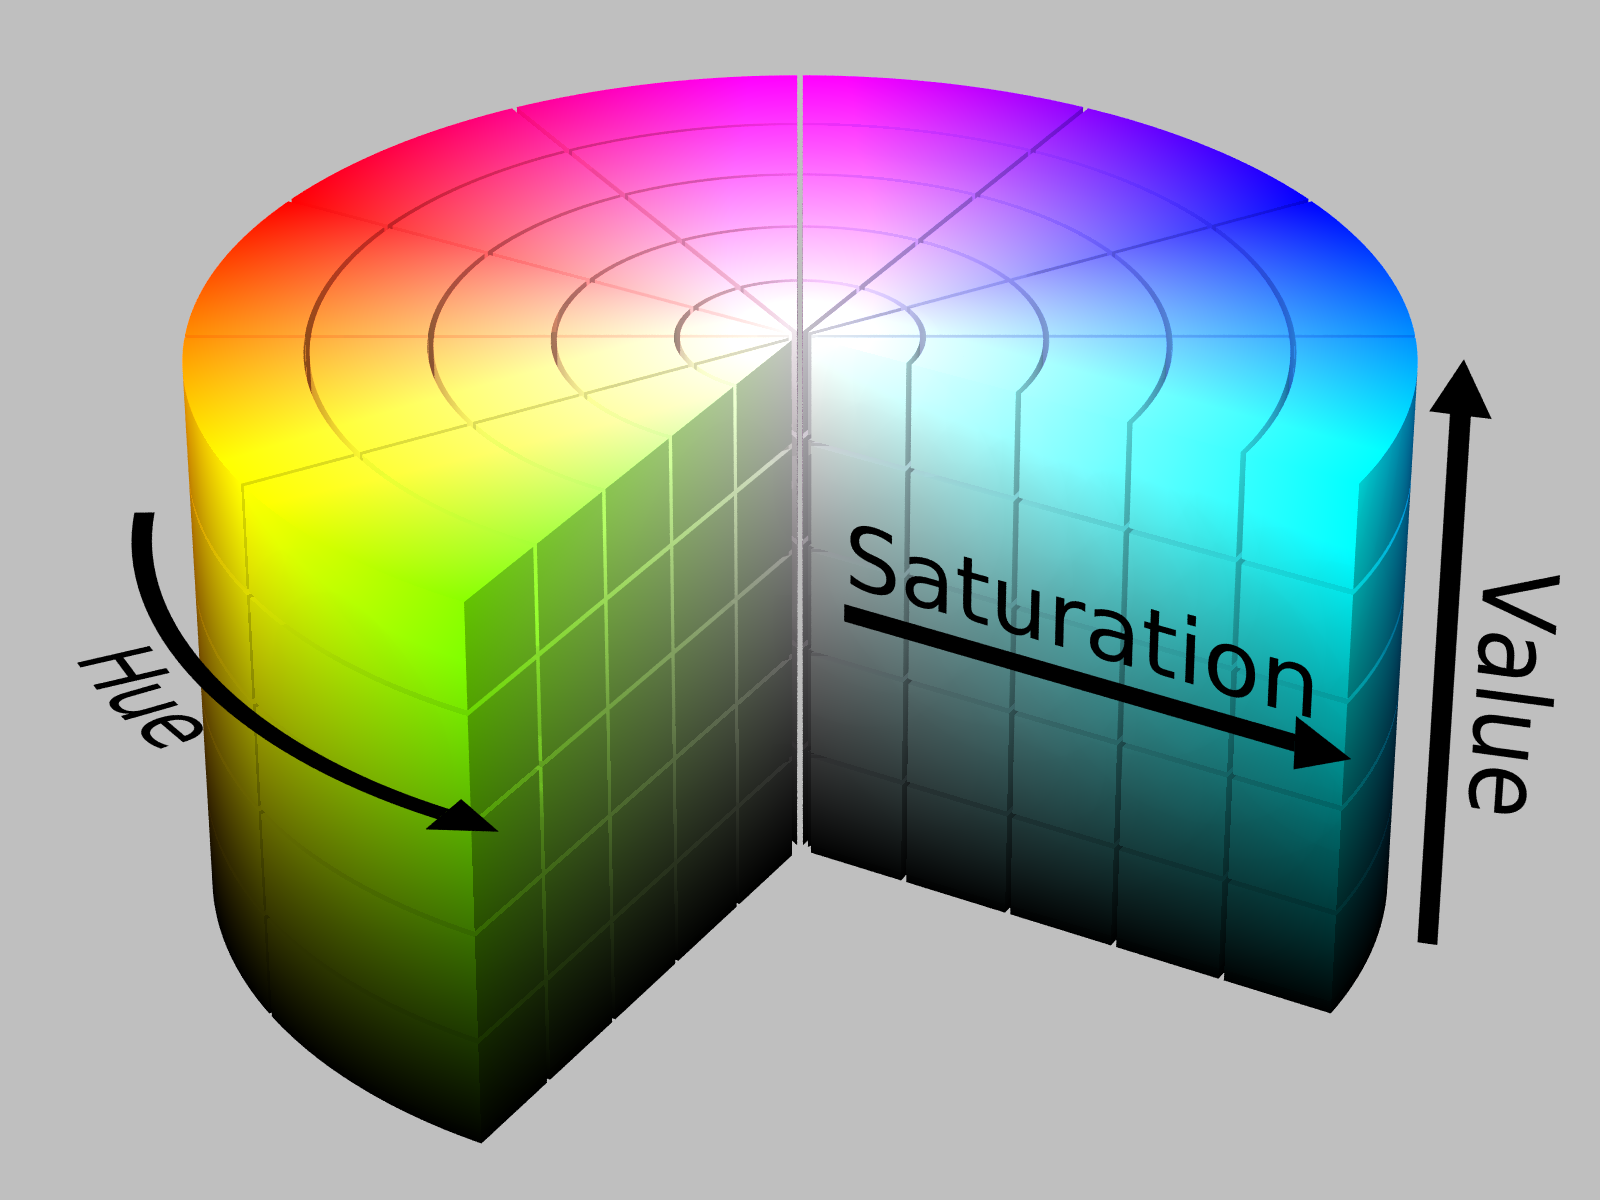
HSV colors arranged in a cylinder
Color Space
A tool used to define the gamut (subset of colors) accurately represented by a device or digital file
Color as:
- chromaticity: (hue, saturation)
- luminance (1d)
sRGB Color Space (HP, Microsoft 1996)
Default in browsers (typical office or home viewing equipment)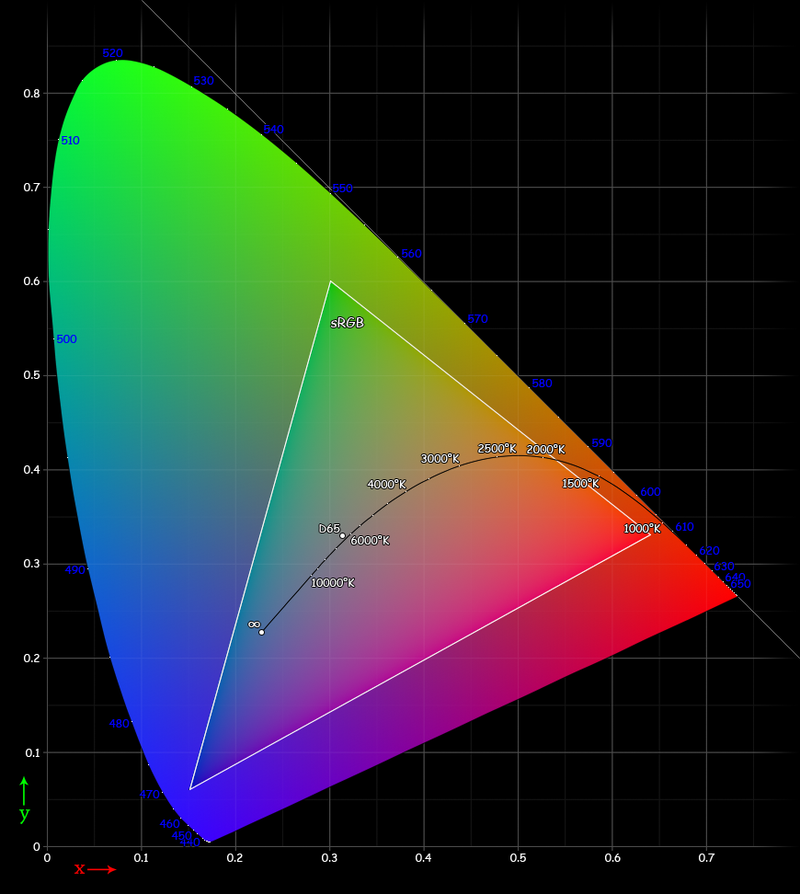
Color matching experiment (Helmholtz & Maxwell 1850)
Subjects adjust wavelengths of primaries to match a sampleMost people will match, same light, same primary colors with the same weights
Outline
- Color perception
- Color theory
- Color design
- Colors in D3
- Complex D3 charts
Use of colors [Tufte]
1. Label: identify, highlight or group
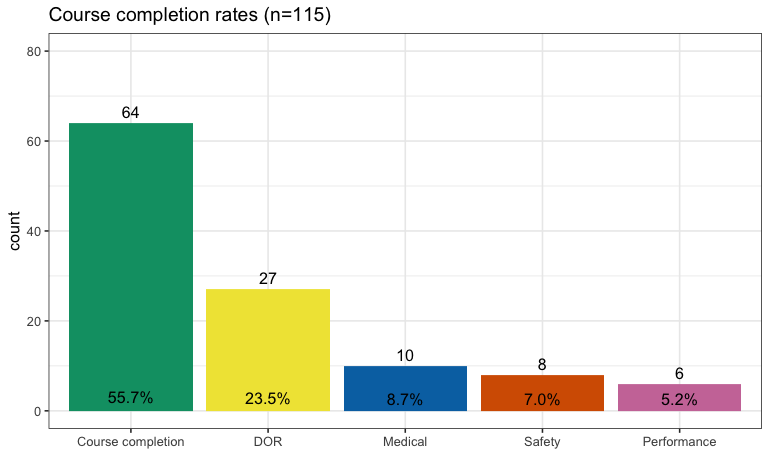
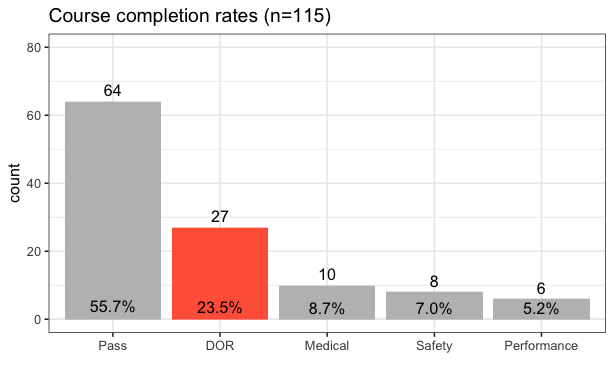
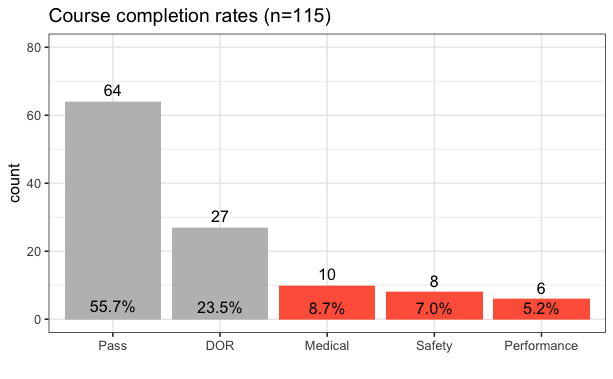
2. Measure, represent or imitate reality

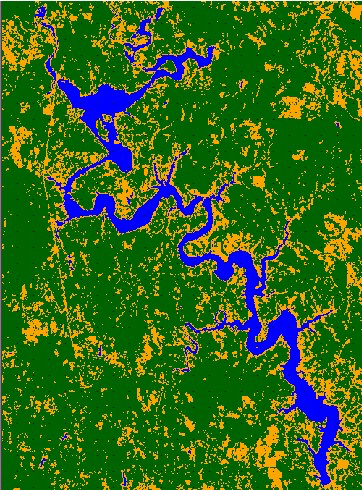

3. Enliven (make more attractive) or decorate
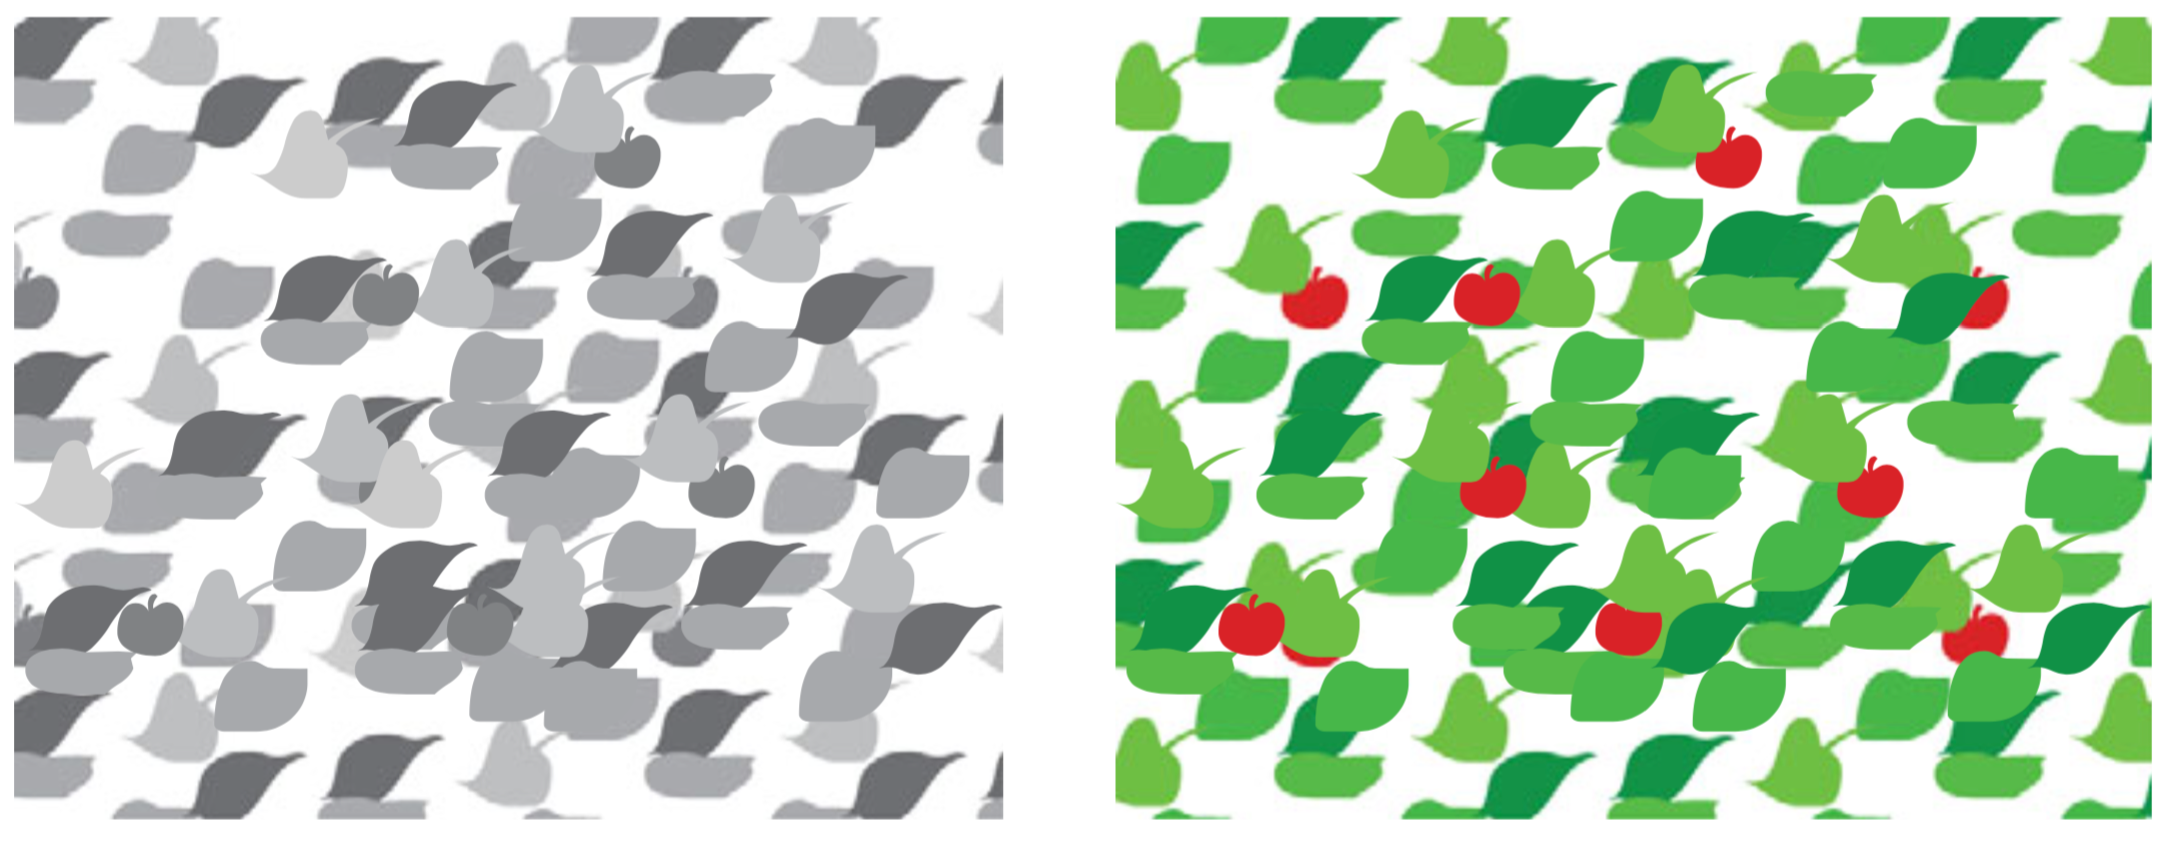
Color rendering of images
| True-color | False-color | Pseudocolor |
|---|---|---|

Colors appear similar a viewer of the image and to an observer of the scene, i.e., RGB → RGB
|
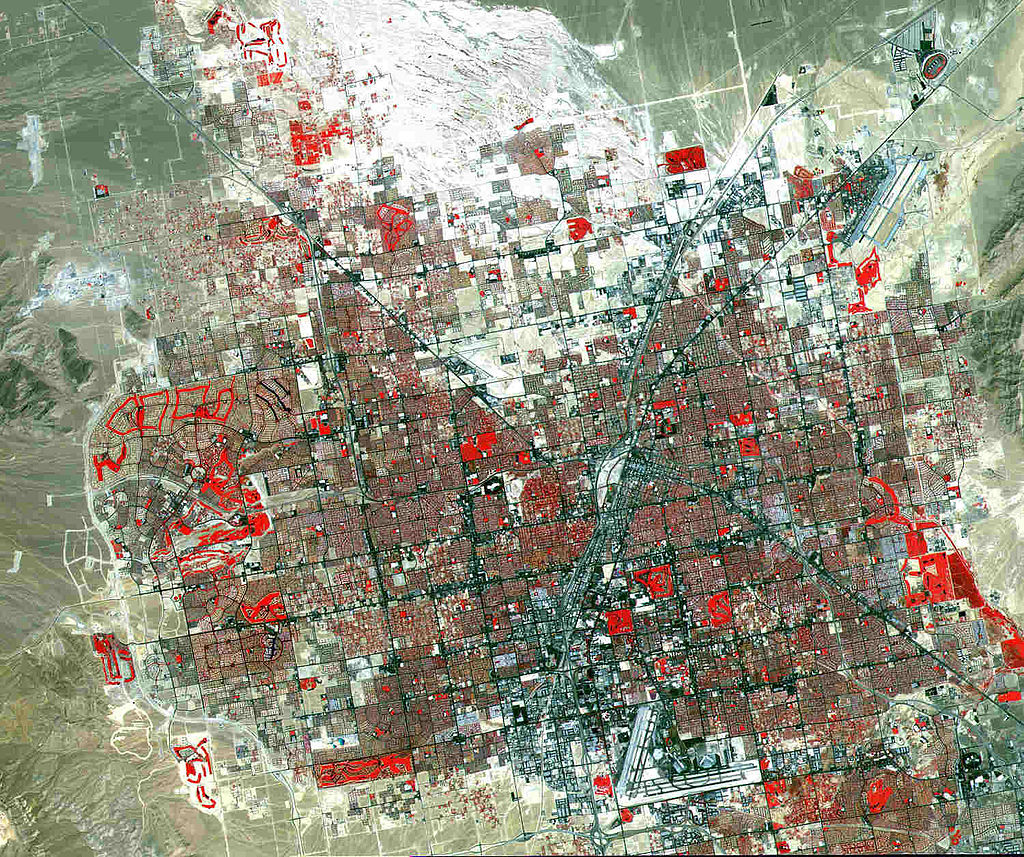
Images in different spectral bands are combined into an RGB image, e.g., NRG → RGB, with N near-infrared band
False-color techniques include:
|

Derived from a grayscale image by mapping each intensity value to a color according to a table or function, e.g., G → RGB
|
Color contrast (results from simultaneous contrast)
Blue text is harder to read (relatively smaller number of S cones)
Red text is easier to read (relatively larger number of L cones)
Green text is easier to read (relatively larger number of M cones)
Achromatic white on black is easier to read than chromatic channels (3 x better than color because we use all 3 receptors)
Achromatic black on white as clear than black on white with less strain used in
Dark mode
If using colors for text and background opponent channels provide the best contrast
If using colors for text and background opponent channels provide the best contrast
When placed next to each other, complementary colors create the strongest contrast for those two colors.
When placed next to each other, complementary colors create the strongest contrast for those two colors.
When placed next to each other, complementary colors create the strongest contrast for those two colors.
Sharpening
We are more sensitive to dark than light differences
Color sequences (aka schemes)
- Use established color sequences, e.g., ColorBrewer
- Use appropriate color sequence type
- Use colorblind safe colors (test with Color Oracle or Dev Tools)
- With discrete scales, limit colors used as keys to 5-7


Color sequences types
| Scheme | Characteristics | Examples |
|---|---|---|
| Sequential | Ordered data, light colors for lower values to dark colors for higher values |  |
| Diverging | Critical class or break in the middle, sequential sequences of contrasting hues on both ends. |  |
| Qualitative | For nominal or categorical data. |  |
Recommendations
| Respect well-established color sequences |  |
| Observe cultural conventions | 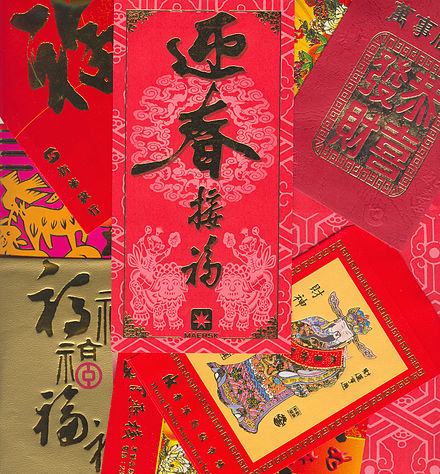 |
| Use color palettes for more attractive and effective displays | 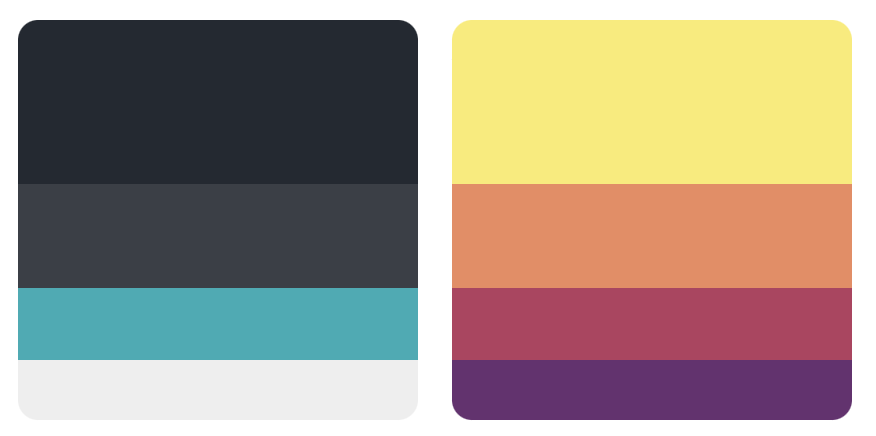 |
Recommendations (continued)
| Use consistent color encodings across graphics | 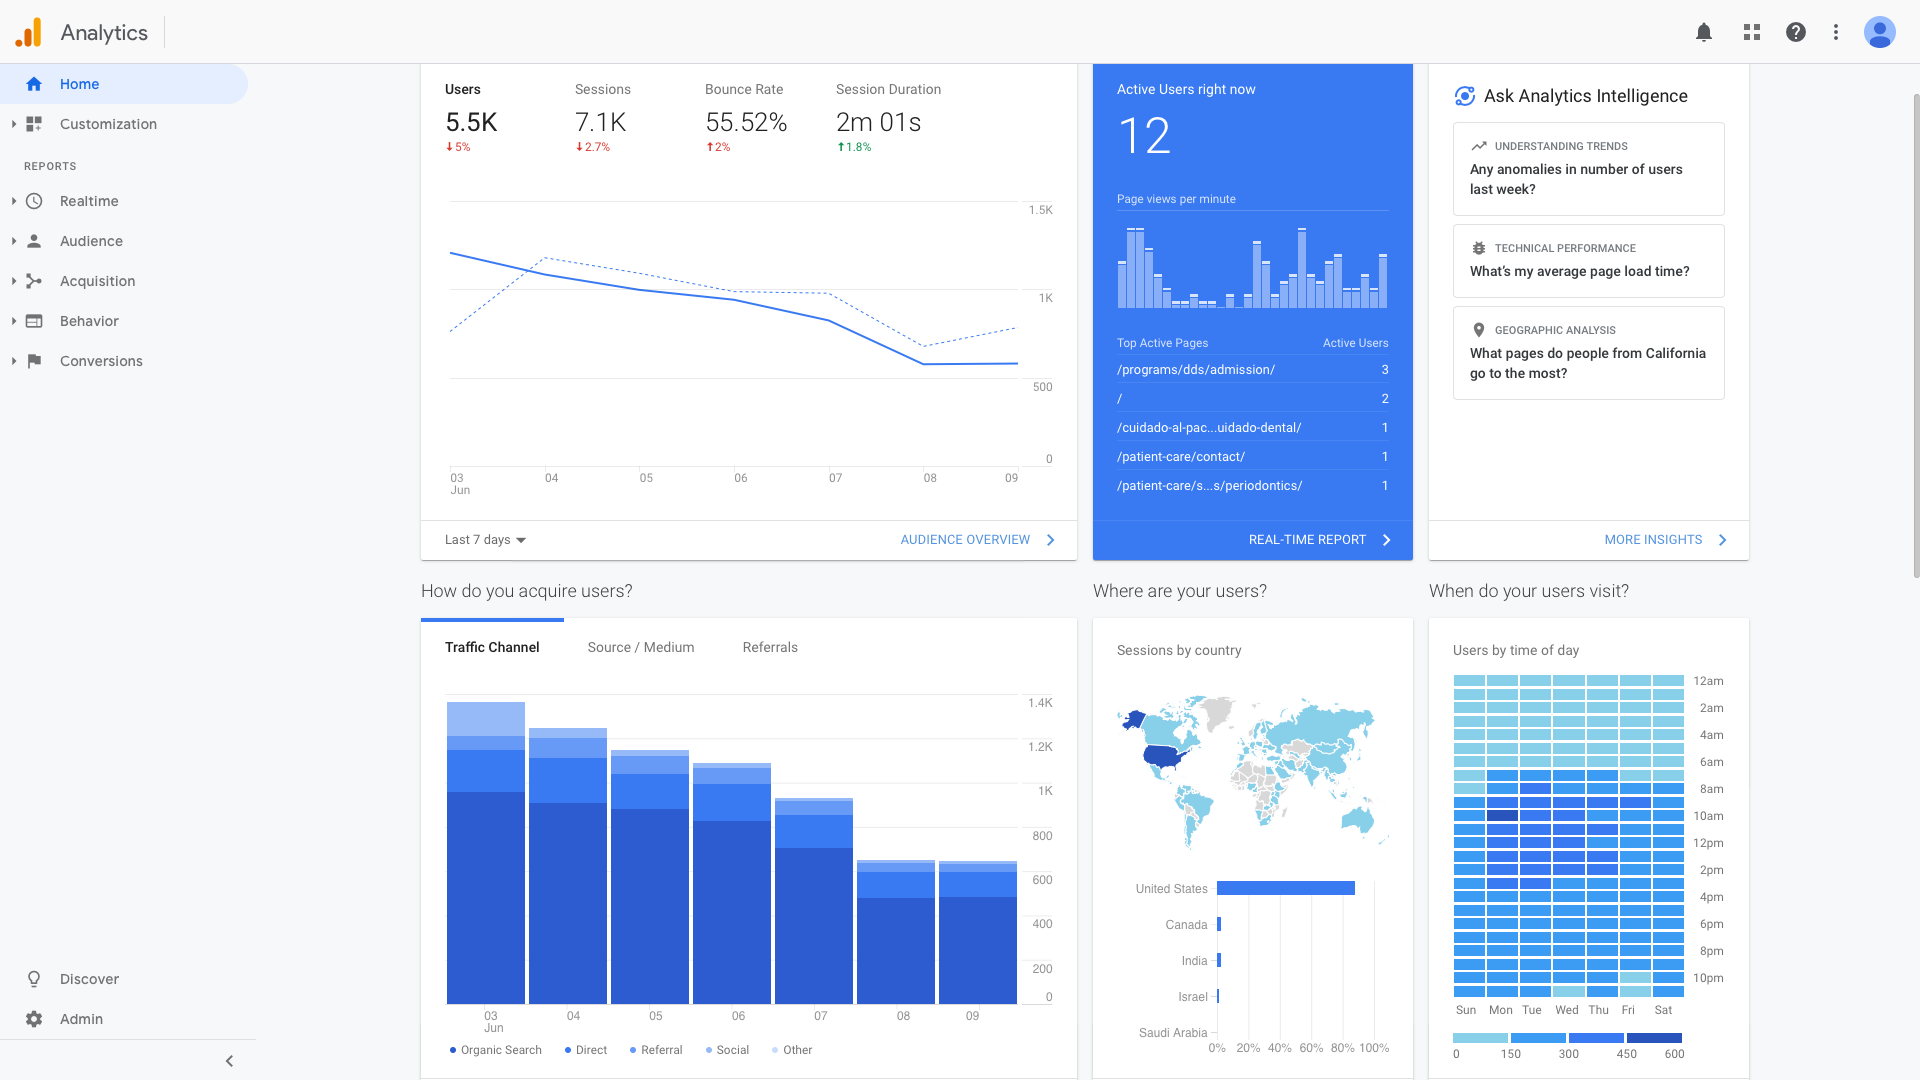 |
| Use colorblind safe colors | 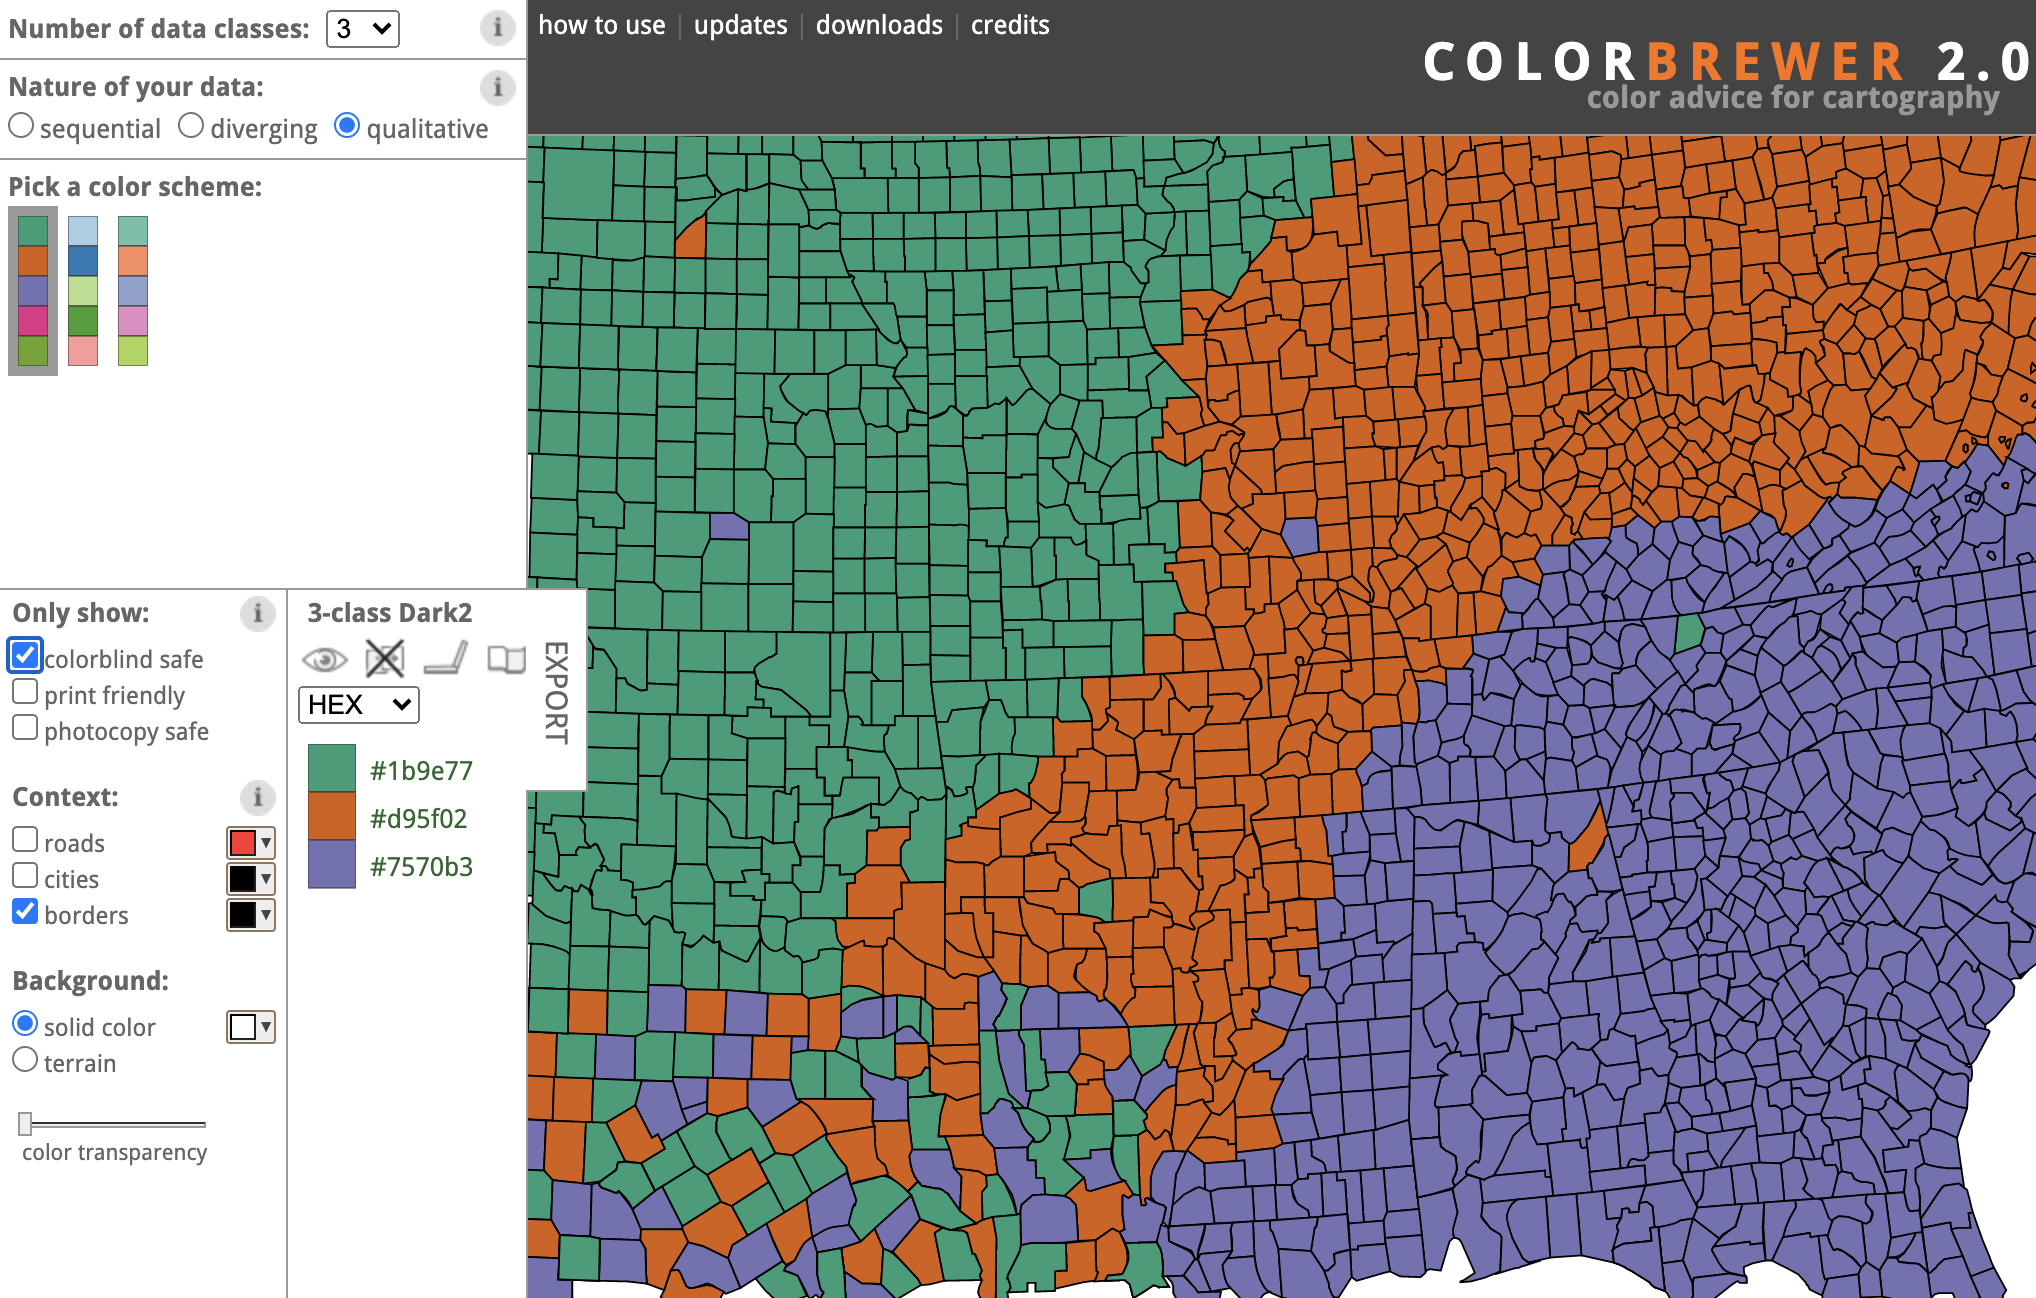 |
| Use accessibility standards: AA (minimum) contrast ratio of 4.5:1 for all text | |
Recommendations (continued)
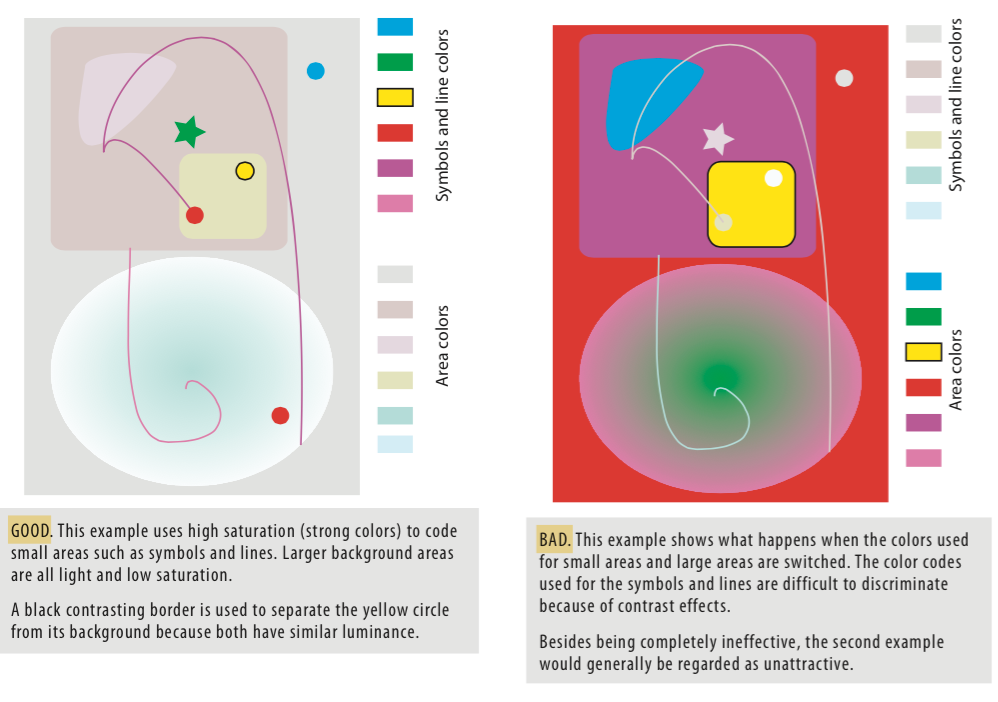
Composition:
- Do not overuse accent colors, instead use accent colors for the most important visual queries
- Use lighter colors for background
Outline
- Color perception
- Color theory
- Color design
- Colors in D3
- Complex D3 charts
D3 color manipulation and color space conversion
					//d3-color and d3-scale-chromatic are included in d3

					//d3-color provides color manipulation and color space conversion.
					var c = d3.hsl("steelblue");
					console.log(c);  //{h: 207.272, s: 0.44, l: 0.343, ...}

					c = c.darker();
					console.log(c);  //{h: 207.272, s: 0.44, l: 0.490, ...}

					c = c.brighter();
					console.log(c);  //{h: 207.272, s: 0.44, l: 0.490, ...}

					//d3-scale-chromatic provides ColorBrewer and other colors schemes
					var accent = d3.schemeAccent;  //["#7fc97f", "#beaed4", "#fdc086", ...]

					//d3-hsv needs to be loaded separately (npm install d3-hsv)
					var yellow = d3.hsv("yellow"); // {h: 60, s: 1, v: 1, opacity: 1}
d3/d3-hsv
d3/d3-scale-chromatic
D3 color scales: d3-scale + colors schemes
| Input Domain Data |
Encoding $\longmapsto$ scale |
Ouput Range Colors |
| Continuous | Discrete | |
|---|---|---|
| Continuous |
Linear Sequential Diverging |
Quantize Quantile |
| Discrete |
Ordinal Threshold |
Outline
- Color perception
- Color theory
- Color design
- Colors in D3
- Complex D3 charts
D3 libraries used to create complex charts
| Library | Type | Description | Charts |
|---|---|---|---|
| d3-shape | Generator | Graphical primitives for visualization, such as lines and areas. | Line, area, pie charts, symbols... |
| d3-chord | Layout | Relationships or network flow in circular layout. | Chord diagram |
| d3-force | Layout | Force-directed graph layout using velocity Verlet integration. | Physical simulations in networks and hierarchies, bubbles charts... |
| d3-hierarchy | Layout | 2D layout algorithms for visualizing hierarchical data. | Treemaps, dendrograms, circle-packing... |
| d3-sankey | Layout | Directed flow between nodes in an acyclic network. | Sankey diagrams |
| d3-hexbin | Generator | Group two-dimensional points into hexagonal bins. | Hexbins plots |
| d3.histogram | Generator | Computes the histogram for the given array. | Histograms |
