
DSCI 554 lecture 5
The eye and the visual brain, D3 scales and axes
Dr. Luciano Nocera

Outline
- The eye and the visual brain
- D3 scales and axes
Visible spectrum
Visible spectrum wavelengths from 400-700nm (in nanometers)
Most people see red
closer than blue
but some see the
opposite effect
Most people see red
closer than blue
but some see the
opposite effect
The lens
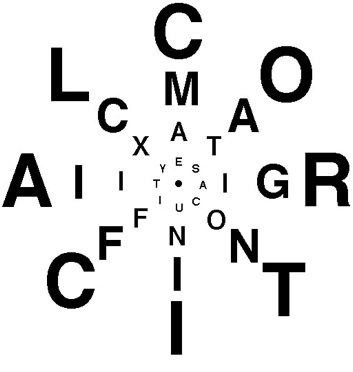
High-res vision in central 1-2° of field of view
The retina
Central high-res vision for the Fovea with Cone cells
Fovea ≈ central 1-2° of field of view
Photoreceptors distribution
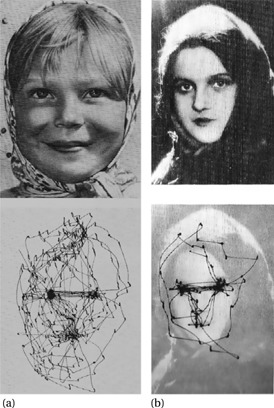
Saccades
- Eye movements (about 3 each second)
- Accompanied by periods of blindness
- $> 200ms$ to initiate
- Fastest movements in body (up to $900^{o} s^{-1}$)
Fixations
- A glimpse
- When visual information is acquired
- Task dependent
The visual system
Eyes, nerves (optic nerve from eyes to brain) and visual cortex (areas V1-5)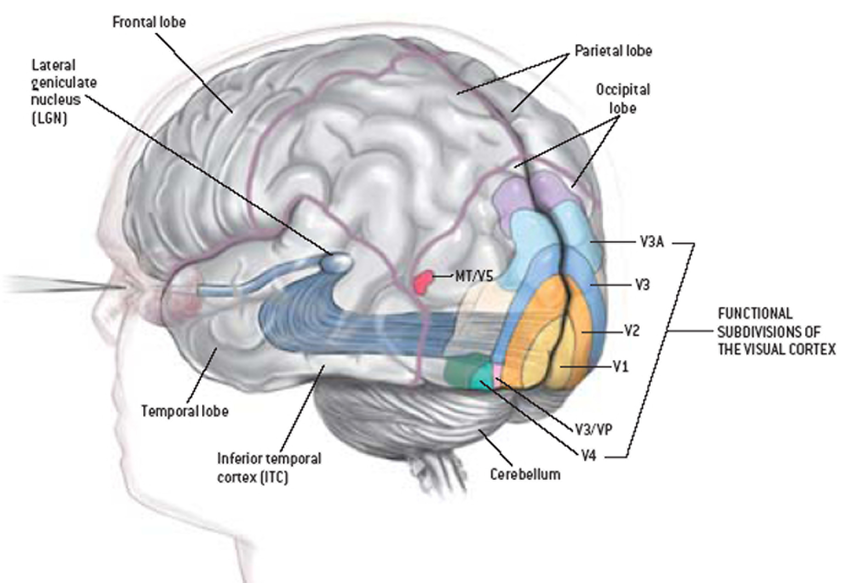
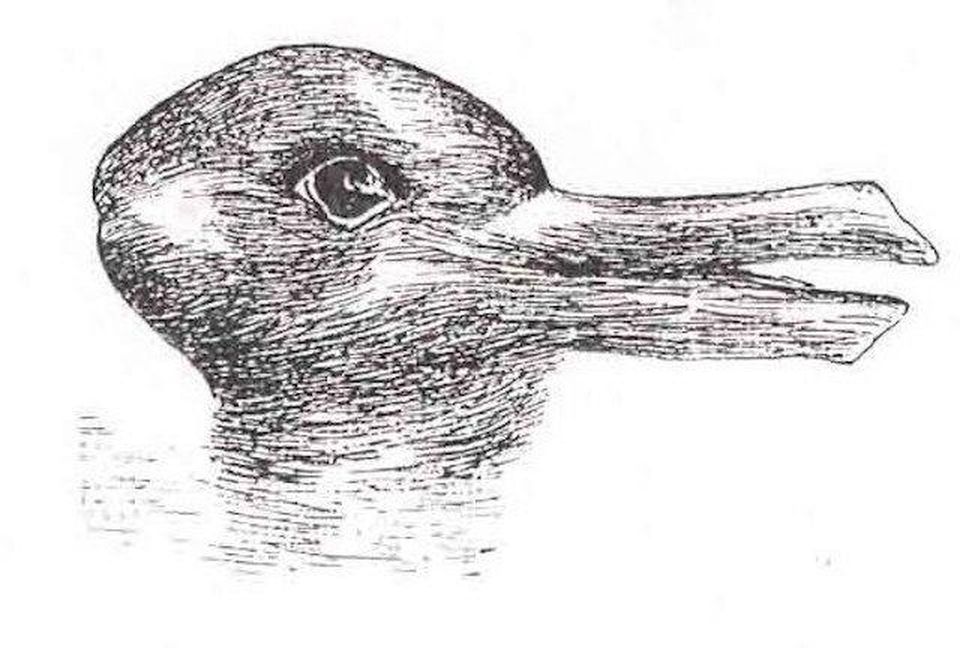
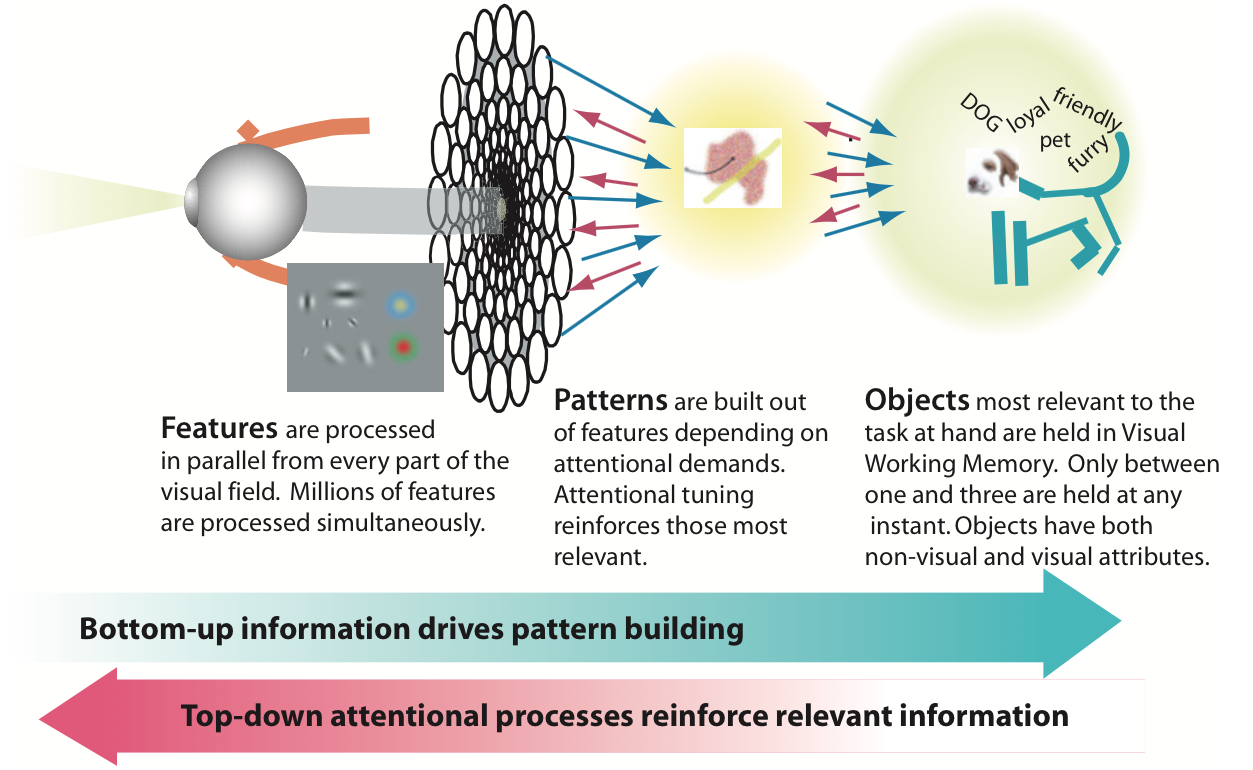
Information processing in the visual system
| Bottom-up or data-driven | Top-down or schema-driven |
|---|---|
| Perception results from transforming sensory input into higher level information | Signals from the eye are integrated and compared to examples in memory |
| Knowledge and attention influence perception | Object knowledge directs the eyes and the feature extraction processing |
Visual queries
Which photoreceptor is present in the fovea?
Answer: almost exclusively cones
Relevant visual queries
- Find
Fovea
label - Find Fovea region on x axis
- Find curve with larger y value (use grid lines)
- Follow corresponding curve and read label
Example of bottom-up processing
Perceiving the lines, e.g., perceived dots in dotted line are integrated into a line representationExample of top-down processing
Search for text, e.g.,Fovea
Visual queries and design considerations
Visual query: a pattern cognitively specified, that if found in the display will contribute to the solution of a problem-- C. Ware
Visual thinking consists of a series of acts of attention, driving eye movements and tuning our pattern-finding circuits-- C. Ware
Carefully craft visualizations to optimize visual queries-- C. Ware
Inattentional blindness
- Failure to detect an unexpected stimulus that is fully visible
- Limited attention allows to focus on one thing at the time
- The brain prioritizes what to focus on
Related implications for design
- For designers ... it is important to know what kinds of visual information the brain can process efficiently [Ware].
- Be aware of inattentional blindness. Never show simultaneous animations on different parts of the screen [Cairo].
- Do not use too many competing stimuli. Filling graphic with objects colored in pure accent tones disorients users [Cairo].
Outline
- The eye and the visual brain
- D3 scales and axes
Scale & axes
Scales
Encodings used to map data to visual representationsAxes
Visual representations of the scale that let us read data valuesAnnotations
Axes
- axis
- axis labels
- axis values
- tick marks
- tick mark labels
- grid lines
Legend
- title
- keys
- key labels
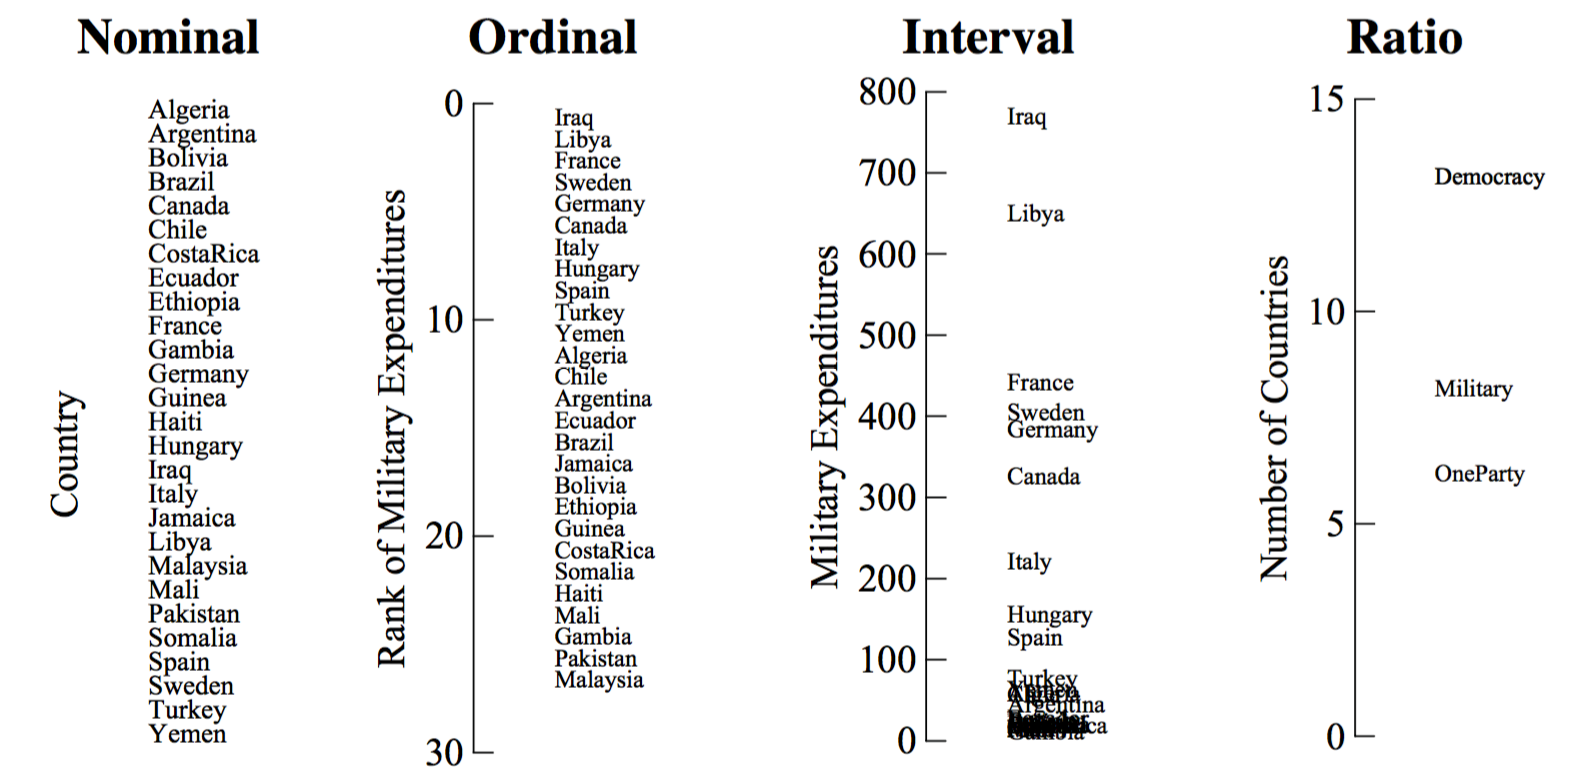
Types of scales [Stevens 1946]
Let's draw a chart with axes using D3!
					var dataset = [['0', 45], ['1', 75], ['2', 130]];

					// define variables to use for chart sizing
					var w = 200;
					var h = 200;
					var pad = 20;

					var svg = d3.select('#svg00')
					  .attr('width', w + 2 * pad)
					  .attr('height', h + 2 * pad)
					  .style('background-color', 'rgb(240, 240, 240)');

					svg.selectAll('rect')
					  .data(dataset)
					  .enter()
					  .append('rect')
					  .attr('x', function (d, i) { return 2 * pad + i * (w / dataset.length); })
					  .attr('y', function (d) { return h - d[1]; })
					  .attr('width', w / dataset.length - pad)
					  .attr('height', function (d) { return d[1]; })
					  .style('fill', 'skyblue');

					svg.selectAll('text')
					  .data(dataset)
					  .enter()
					  .append('text')
					  .text(function (d) { return d[0]; })
					  .attr('x', function (d, i) {
					    return 2 * pad + i * (w / dataset.length) + (w / dataset.length - pad) / 2; })
					  .attr('y', function (d) { return h + 15; })
					  .style('fill', 'black')
					  .style('font-size', '16px')
					  .style('text-anchor', 'middle')
					  .style('alignment-baseline', 'middle');

					svg.selectAll('line')
					  .data(dataset)
					  .enter()
					  .append('line')
					  .attr('x1', function (d, i) {
					    return 2 * pad + i * (w / dataset.length) + (w / dataset.length - pad) / 2; })
					  .attr('y1', function (d) { return h + 5; })
					  .attr('x2', function (d, i) {
					    return 2 * pad + i * (w / dataset.length) + (w / dataset.length - pad) / 2; })
					  .attr('y2', function (d) { return h; })
					  .style('stroke', 'black');

					svg.append('line')
					  .attr('x1', 2 * pad)
					  .attr('y1', h)
					  .attr('x2', w + pad)
					  .attr('y2', h)
					  .style('stroke', 'black');

					svg.append('line')
					  .attr('x1', 2 * pad)
					  .attr('y1', h)
					  .attr('x2', 2 * pad)
					  .attr('y2', pad)
					  .style('stroke', 'black');
					svg.append('line')
						.attr('x1', 2 * pad)
						.attr('y1', h - 40)
						.attr('x2', 2 * pad - 5)
						.attr('y2', h - 40)
						.style('stroke', 'black');

					svg.append('text')
						.text('40')
						.attr('x', pad)
						.attr('y', h - 40)
						.style('fill', 'black')
						.style('font-size', '16px')
						.style('text-anchor', 'middle')
						.style('alignment-baseline', 'middle');

					svg.append('line')
						.attr('x1', 2 * pad)
						.attr('y1', h - 80)
						.attr('x2', 2 * pad - 5)
						.attr('y2', h - 80)
						.style('stroke', 'black');

					svg.append('text')
						.text('80')
						.attr('x', pad)
						.attr('y', h - 80)
						.style('fill', 'black')
						.style('font-size', '16px')
						.style('text-anchor', 'middle')
						.style('alignment-baseline', 'middle');

					svg.append('line')
						.attr('x1', 2 * pad)
						.attr('y1', h - 120)
						.attr('x2', 2 * pad - 5)
						.attr('y2', h - 120)
						.style('stroke', 'black');

					svg.append('text')
						.text('120')
						.attr('x', pad)
						.attr('y', h - 120)
						.style('fill', 'black')
						.style('font-size', '16px')
						.style('text-anchor', 'middle')
						.style('alignment-baseline', 'middle');

					svg.append('line')
						.attr('x1', 2 * pad)
						.attr('y1', h - 160)
						.attr('x2', 2 * pad - 5)
						.attr('y2', h - 160)
						.style('stroke', 'black');

					svg.append('text')
						.text('160')
						.attr('x', pad)
						.attr('y', h - 160)
						.style('fill', 'black')
						.style('font-size', '16px')
						.style('text-anchor', 'middle')
						.style('alignment-baseline', 'middle');
D3 scales and axes to the rescue!
How D3 scales work
Input (Data)
Domain
$\longrightarrow$
Output (Representation)
Range
								data = [10, 20, 30, 50, 80, 100];

								min = d3.min(data);  //10
								max = d3.max(data);  //100

								domain = [10, 100];
range = [100, 400];
Types of D3 scales
| Continuous | Ordinal |
|---|---|
|
|
|
|
d3.scaleLinear()
$$
y = a \, x + b \\
$$
				dataset = [100, 120, 150];

				var x = d3.scaleLinear()  //function are objects in js
				  .domain([d3.min(dataset), d3.max(dataset)])  //extent of the data
				  .range([0, 100]);  //range is the extent of the svg in pixels

				x(125);  //50
💡 You can run the code in the console!
d3.scaleTime()
$$ y = a \, t + b \\ $$
				//use Date() to specify time in milliseconds
				var x = d3.scaleTime()
				  .domain([new Date(2018, 8, 20), new Date(2018, 11, 12)])
				  .range([0, 960]);

				x(new Date(2018, 11, 30));  //evaluate for date
				x(Date.now());  //evaluates scale for today's date
💡 You can run the code in the console!
d3.scaleLog()
$$ y = a \, log(x) + b \\ $$
				var x = d3.scaleLog()
				  .domain([1, 10000])
				  .range([0, 1000])
				  .base(10);

				x(10);  //250
				x(10000);  //1000
💡 You can run the code in the console!
d3.scaleOrdinal()
				var x = d3.scaleOrdinal()
				  .domain(['0', '1', '2'])  //discrete domain
				  .range([0, 1, 2]);

				x('0');  //0
				x('1');  //1
💡 You can run the code in the console!
d3.scaleBand()

				var x = d3.scaleBand()
				  .domain(['0', '1', '2'])  //discrete domain
				  .range([0, 600])
				  .paddingInner(0.05);  //set inner padding in [0, 1], dafaults to 0.

				x('0');  //0
				x('1');  //303.4
				x.bandwidth();  //193.2
💡 You can run the code in the console!
d3.scalePoint()
Same as scaleBand() with bandwidth = 0
				var x = d3.scalePoint()
				  .domain(['0', '1', '2'])  //discrete domain
				  .range([0, 600]);

				x('0');  //0
				x('1');  //300
💡 You can run the code in the console!
Boilerplate code for drawing axes
						var svg = d3.select('#svg02')
						  .attr("width", 400)
						  .attr("height", 400);

						// 1. CREATE SCALE FOR AXIS
						var scale = d3.scaleLinear()
						  .domain([0, 10])
						  .range([0, 300]);

						// 2. CREATE AXIS AND SET THE SCALE
						var axis = d3.axisLeft(scale);

						// 3. ADD AXIS IN A GROUP AND PLACE
						svg.append("g")
						  .attr("transform", "translate(50,50)")
						  .call(axis);  //call axis to draw
4 types of D3 axes
							var svg = d3.select('#svg03')
							  .attr("width", 400)
							  .attr("height", 400);

							var scale = d3.scaleLinear()
							  .domain([0, 10])
							  .range([0, 300]);

							//vertical axis with ticks on the left
							var axis_l = d3.axisLeft(scale);

							//vertical axis with ticks on the right
							var axis_r = d3.axisRight(scale);

							//horizonal axis with ticks on the top
							var axis_t = d3.axisTop(scale);

							//vertical axis with ticks on the bottom
							var axis_b = d3.axisBottom(scale);

							svg.append("g")
							  .attr("transform", "translate(50,50)")
							  .call(axis_l);

							svg.append("g")
							  .attr("transform", "translate(350,50)")
							  .call(axis_r);

							svg.append("g")
							  .attr("transform", "translate(50,50)")
							  .call(axis_t);

							svg.append("g")
							  .attr("transform", "translate(50,350)")
							  .call(axis_b);
Boilerplate code for styling axes
						<style type="text/css">
						  #svg04 path {
						    stroke: blue;
						  }
						  #svg04 .dashed-axis path {  //axis is <path>
						    stroke: orange;
						    stroke-dasharray: 5,5;
						  }
						  #svg04 .tick line {  //ticks are <line>
						    stroke: green;
						    stroke-width: 5px;
						    shape-rendering: crispEdges;
						  }
						  #svg04 .tick text {
						    stroke: red;
						    font-family: sans-serif;
						    font-size: 16px;
						  }
						</style>

						<script>
						  var svg = d3.select('#svg04')
							.attr("width", 400)
							.attr("height", 400);
						  var y = d3.scaleLinear().domain([0, 10]).range([300, 0]);
						  var x = d3.scaleLinear().domain([0, 10]).range([0, 300]);
						  var axis_l = d3.axisLeft(y).ticks(3);
						  var axis_b = d3.axisBottom(x).ticks(3);
						  svg.append("g")
						    .attr("transform", "translate(50,50)")
						    .attr('class', 'dashed-axis')
						    .call(axis_l);
						  svg.append("g")
						    .attr("transform", "translate(50,350)")
						    .call(axis_b);
						</script>
Boilerplate code for axes labels and grid lines
								<style>
								  .label {
								    font-size: 18px;
								    text-anchor: middle;
										alignment-baseline: middle;
								  }

								  .dashed-axis path {
										stroke-dasharray: 3, 3;
								  }
								</style>
								<script>
								  var svg = d3.select('#svg05').attr("width", 400).attr("height", 400);

								  var y = d3.scaleLinear().domain([0, 10]).range([300, 0]);
								  var x = d3.scaleLinear().domain([0, 10]).range([0, 300]);
								  var axis_l = d3.axisLeft(y)
								  var axis_b = d3.axisBottom(x)

								  svg.append("g")
								    .attr("transform", "translate(50,50)")
								    .call(axis_l);

								  svg.append("g")
								    .attr("transform", "translate(50,350)")
								    .call(axis_b);

								  var axis_hg = d3.axisBottom(x)  //create and place grid lines
								    .tickSize(0)
								    .ticks(0);

								  var axis_vg = d3.axisLeft(x)
								    .tickSize(0)
								    .ticks(0);

								  svg.append("g")
								    .attr("transform", "translate(50,200)")
								    .attr('class', 'dashed-axis')
								    .call(axis_hg);

								  svg.append("g")
								    .attr("transform", "translate(200,50)")
								    .classed('dashed-axis', true)
								    .call(axis_vg);

								  svg.append("text")  //create and place labels
								    .attr("x", 200)
								    .attr("y", 385)
								    .classed('label', true)
								    .text("axisBottom");

								  svg.append("text")
								    .attr("x", -200)
								    .attr("y", 15)
								    .classed('label', true)
								    .attr("transform", "rotate(-90)")
								    .text("axisLeft");
								</script>
Margin convention
				var margin = {top: 20, right: 20, bottom: 20, left: 20};  //step1: set margin
				var width = 600 - margin.left - margin.right,  //step2: set width and height
				    height = 300 - margin.top - margin.bottom;

				var svg = d3.select("body").append("svg")  //step3: set-up svg
				  .attr("width", width + margin.left + margin.right)
				  .attr("height", height + margin.top + margin.bottom)
				  .append("g")
				  .attr("transform", "translate(" + margin.left + "," + margin.top + ")");
Facilitates plots:
|
Let's put it together!
							<svg id="p_39_1" style="background-color: #f0f0f0; margin-right: 40px"></svg>

							<style>
								path { stroke: black; }
								.tick line { stroke: black; }
								.tick { stroke: black; }
								.tick text {
									stroke: none;
									fill: black;
									font-size: 16px;
								}
							</style>

							<script>
								var data = [['0', 45], ['1', 75], ['2', 130]];

								var margin = { top: 30, right: 20, bottom: 30, left: 40 };
								var width = 240 - margin.left - margin.right,
									height = 240 - margin.top - margin.bottom;

								var x = d3.scaleBand()
									.domain(data.map(d => d[0]))
									.range([0, width])
									.paddingInner(.3);

								var y = d3.scaleLinear()
									.domain([0, d3.max(data, d => d[1]) + margin.top + + margin.bottom])
									.range([height, 0]);

								var xAxis = d3.axisBottom()
									.scale(x);

								var yAxis = d3.axisLeft()
									.scale(y)
									.tickValues([40, 80, 120, 160]);

								var svg = d3.select("#p_39_1")
									.attr("width", width + margin.left + margin.right)
									.attr("height", height + margin.top + margin.bottom)
									.append("g")
									.attr("transform", "translate(" + margin.left + "," + margin.top + ")");

								svg.selectAll('rect')
									.data(data)
									.enter()
									.append('rect')
									.attr('x', (d) => x(d[0]) )
									.attr('y', (d) => y(d[1]) )
									.attr('width', x.bandwidth)
									.attr('height', (d) => height - y(d[1]) )
									.style('fill', 'skyblue');

								svg.append("g")
									.attr("transform", "translate(0," + height + ")")
									.call(xAxis);

								svg.append("g")
									.call(yAxis);
							</script>