
DSCI 554 lecture 3
Design space of visualizations, graphing in the browser, introduction to D3 and VEGA
Dr. Luciano Nocera

Outline
- Design space and design trade-offs
- Graphing in the browser
- Introduction to D3
- Introduction to Vega and Vega-lite
Infographics (a clipped compound of "information" and "graphics") are graphic visual representations of information, data or knowledge intended to present information quickly and clearly. They can improve cognition by utilizing graphics to enhance the human visual system's ability to see patterns and trends.
-- Wikipedia infographic
A dashboard is a type of graphical user interface which often provides at-a-glance views of key performance indicators (KPIs) relevant to a particular objective or business process. In other usage, "dashboard" is another name for "progress report" or "report.".
-- Wikipedia Dashboard (business)
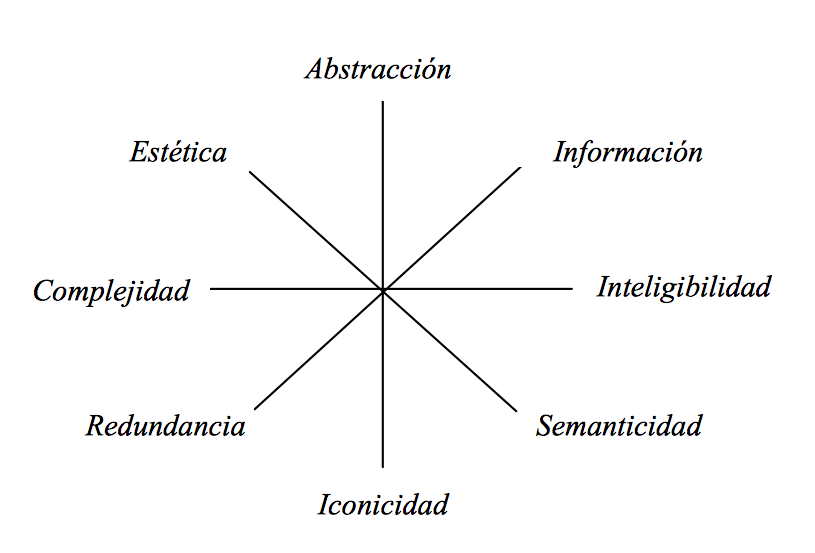
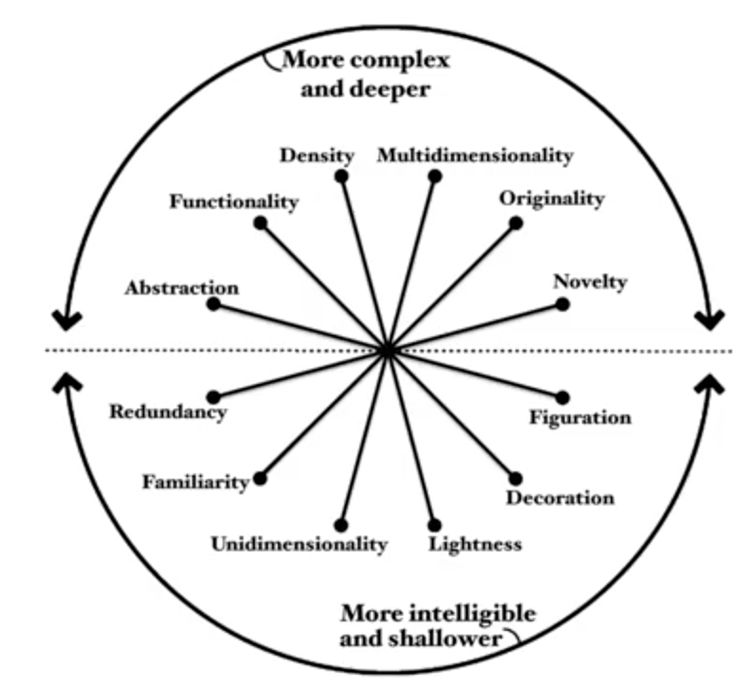
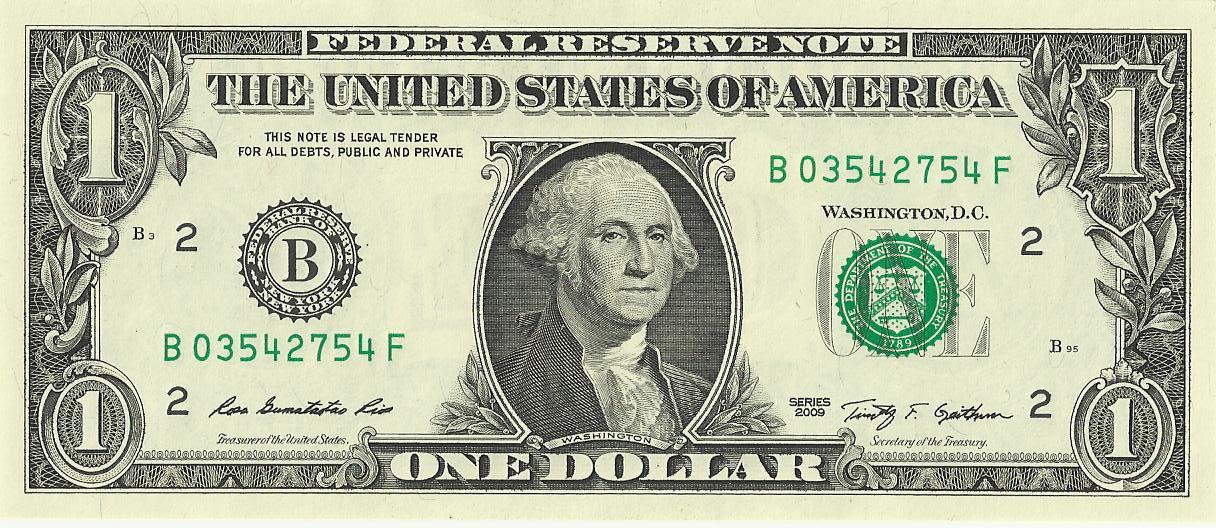 |
Figuration-AbstractionMeasures the distance fromreferent referent is the thing that a graphical form or mark stands for. to the representation representation is the graphical form or mark |
$ |
Decoration-FunctionalityMeasures the amount of informative content |
||
Lightness-DensityMeasures the amount of content displayed in relation to space |
||
Unidimensionality-MultidimensionalityMeasures the number of layers and forms used to encode the data |
||
Familiarity-OriginalityMeasures how challenging the forms are for the user to understand |
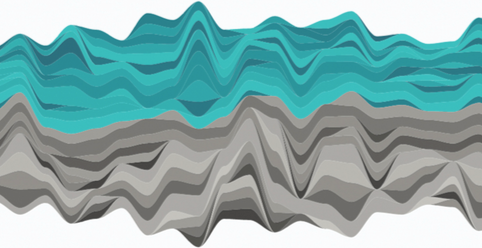 |
|
  |
Redundancy-NoveltyMeasures the number of times things are explained |
 |
Outline
- Design space and design trade-offs
- Graphing in the browser
- Introduction to D3
- Introduction to Vega and Vega-lite
Bar chart in plain HTML
Top 10 COVID-19 confirmed in US, Aug 31 2020 (source Johns Hopkins University)
Los Angeles
240,749
Miami-Dade
156,559
Maricopa
133,641
Cook
126,003
Harris
105,757
Broward
70,950
Dallas
70,810
Queens
69,370
Kings
63,974
Clark
59,153
Line chart in SVG
Document Object Model (DOM)
- Hierarchical box model (conceptual data model)
- Used in browsers for pages (HTML documents)
- Implemented as
Javascript object
- In the DOM everything is implemented as a node:
- The document is the document node
- HTML elements are element nodes
- HTML attributes are attribute nodes
- Text inside HTML elements are text nodes
- Comments are comment nodes
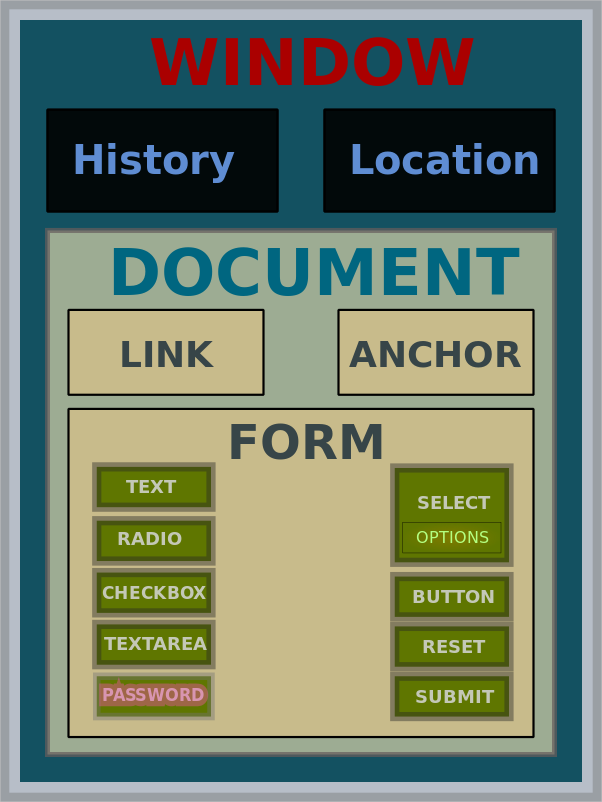
DOM example
HTML table
							<TABLE>
							  <TBODY>
							  <TR>
							    <TD>Col 1</TD>
							    <TD>Col 2</TD>
							  </TR>
							  <TR>
							    <TD>Col 3</TD>
							    <TD>Col 4</TD>
							  </TR>
							  </TBODY>
							</TABLE>
DOM Tree of HTML table
CSS box model
- Everything in CSS has a box around it
- There are 2 main types of boxes:
- Inline: occupy the space bounded by the tag
- Block: start on a new line and take up the full width
- The type of box is controlled by the CSS
propertydisplay: [inline|block] - You can override the defaults type as
blockorinline
span is <span>inline</span>
span is inline
div is <div>block</div>
div is
block
div can become <div style="display: inline">inline</div>
div can become
inline
Graphing with HTML, SVG, CSS
Global vs. element specific attributes
Global attributes (id, class, style)
					<!-- Use id to reference containers for dynamic charts -->
					<div id="chart1"></div>
					<svg id="chart2"></svg>

					<style>
					  div.bar { background-color: red; }
					  circle.dot { fill: red; }
					</style>

					<!-- Use class to apply common styles -->
					<div class="bar" style="width: 600px">bar 1</div>

					<svg style="background-color: lightpink">
					  <circle class="dot" cx="5" cy="5" r="2"/>
					</svg>
Element specific attributes
					<!-- Use element specific attributes to place and size -->
					<img src="pict.png" width="20px"\>

					<svg style="background-color: lightpink">
					  <circle cx="5" cy="5" r="2"/>
					</svg>
style for coloring & box sizing
Control color in HTML tags
				background-color: brown; /* background color of an element */
				color: white;  /* color of text within element */
Control box model parameters
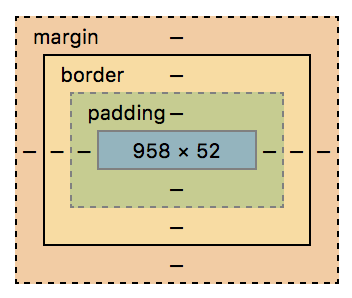
Border: border around an element.
Padding: extra space within an element.
padding: 1em;  /* Apply to all four sides */
padding: 5% 10%;  /* vertical | horizontal */
padding: 1em 2em 2em;  /* top | horizontal | bottom */
padding: 5px 1em 0 2em;  /* top | right | bottom | left */

border: 1px solid red;  /* width | style | color */

margin: 1em;  /* Apply to all four sides */
margin: 5% auto;  /* vertical | horizontal */
margin: 1em auto 2em;  /* top | horizontal | bottom */
margin: 2px 1em 0 auto;  /* top | right | bottom | left */
style for coloring & box sizing (example)
before
DIV
after
						before
						<div style="color: yellow; background-color:blue; margin: 100px 100px; padding: 50px 50px; border: 10px solid red; ">DIV</div>
						after
style for sizing
						<div style="background-color: red; margin-bottom: 10px;">bar1</div>
						<div style="background-color: red; margin-bottom: 10px; width: 200px; height: 20px;">bar2</div>
						<div style="background-color: red; width: 100px; height: 20px;">bar3</div>
bar1
bar2
bar3
CSS inheritance and CSS classes
In CSS properties are inherited by descendants.
Style the parent not to repeat properties in descendants
Define a class as a short hand for common descendants properties
Style the parent not to repeat properties in descendants
Define a class as a short hand for common descendants properties
						<style>
						  .redbar {
						    background-color: red;
						    height: 50px;
						    margin-bottom: 10px;
						  }
						</style>

						<div style="height: 20px; font-size: 0.5em; font-weight: bolder;">
						  <div class="redbar">bar1</div>
						  <div class="redbar" style="width: 200px;">bar2</div>
						  <div class="redbar" style="width: 100px;">bar3</div>
						</div>
bar1
bar2
bar3
SVG
- SVG elements are drawn in the <svg>
- Coordinate system in pixels starting up left corner of <svg>
- Painter's algorithm defines drawing order:
coding order is drawing order (last drawn on top)
HTML vs. SVG for charting
| HTML | SVG | |
|---|---|---|
| Placement & sizing | CSS box model relative/absolute placement | Cartesian coordinate system and viewport |
| Primitives | CSS box model boxes | Named shapes, curves |
| Text | inner HTML | <text> |
| Drawing order | CSS box model / DOM order | Painter's algorithm coding order → depth order |
| Hierarchy | CSS box model | Nesting using <g> |
SVG basic shapes
- <rect>: rectangle (w rounded corners)
- <circle>: circle
- <ellipse>: ellipse
- <line>: line
- <polyline>: polyline
- <polygon>: polygon
SVG basic shapes attributes
- Positions & size
- Fill (interior color)
- Stroke (border color)
						<rect x="10" y="10" width="80" height="80" rx="5" ry="5" fill="orange"/>

						<circle cx="150" cy="50" r="40" fill="green"/>

						<ellipse cx="260" cy="50" rx="50" ry="25" fill="brown"/>

						<line x1="320" y1="20" x2="380" y2="80" stroke="blue"/>

						<polyline points="420,35 490,65 490,35 420,65" stroke="red" fill="none"/> <!-- open -->

						<polygon points="560,10 600,30 600,70 560,90 520,70 520,30" fill="tan"/> <!-- closed -->
SVG visibility & attributes defaults
- Positions & size (e.g., x, y, x1, y1, x2, y2, cx, cy, width, height, r, rx, ry) defaults to
0
- Fill defaults to
black
for shapes andnone
for text - Stroke defaults to
none
						<rect x="10" y="10" idth="80" height="80" rx="5" ry="5" fill="orange"/> <!-- width="0" -->

						<circle x="150" y="50" r="40" fill="green"/> <!-- cx="0" cy="0"-->

						<ellipse cx="260" cy="50" rx="50" ry="25" background-color="brown"/> <!-- fill="black" -->

						<line x1="320" y1="20" x2="380" y2="80" color="red"/> <!-- stroke="none" -->

						<polyline points="420,35 490,65 490,35 420,65" stroke="myred" fill="none"/> <!-- stroke="none" -->

						<polygon oints="560,10 600,30 600,70 560,90 520,70 520,30" fill="tan"/> <!-- points="" -->

						<text x="600">Hello</text> <!-- text element requires a y, here y="none" -->
SVG styling properties
MOST BUT NOT ALL SVG attributes have CSS styling properties
						<svg>


						  <rect style="x: 10; y: 10; width: 80; height: 80; rx: 5; ry: 5; fill: orange;"/>

						  <circle style="cx: 150; cy: 50; r: 40; fill: lime; stroke:orange; stroke-width: 8px;"/>

						  <ellipse style="cx: 260; cy: 50; rx: 50; ry: 25; fill: brown;"/>


						  <line style="x1: 320; y1: 20; x2: 380; y2: 80; stroke: blue;"/>

						  <polyline style="points: 420,35 490,65 490,35 420,65; stroke: red; fill: none;"/>

						  <polygon style="points: 560,10 600,30 600,70 560,90 520,70 520,30; fill: tan;"/>
						</svg>
Positioning SVG text
						<svg>
						  <text x="0" y="70">Text0<text/>
						</svg>
x, y define where the text is placed in the SVG (by default the text bottom left is located at x, y)text-anchor controls the horizontal placement of the text relative to
x, y
text-anchor: start ← defaulttext-anchor: middletext-anchor: end
|
alignment-baseline controls the vertical placement of the text relative to
x, y
alignment-baseline: hanging alignment-baseline: middlealignment-baseline: unset ← default
|
Centering SVG text
					<svg>
					  <text x="0" y="70">Text0<text/>
					  <text x="200" y="70" text-anchor="middle" alignment-baseline="middle">Text1<text/>
					  <text x="350" y="70" style="text-anchor: middle; alignment-baseline: middle;">Text2<text/>
					</svg>
What will appear on the page?
						<svg>
						<polygon points="60,10 100,30 100,70 60,90 20,70 20,30" fill="tan">text</polygon>
						</svg>
- Tan polygon
- Tan polygon and text
- Only text
- Nothing
What will appear on the page?
					  <svg>
					    <circle cx="100" cy="100" fill="red"/>
					    <text>Hello</text>
					  </svg>
- Red circle
- Red circle and text
- Text
- Nothing
What choice corresponds to the figure shown?
						<svg style="background-color: lightgrey">
						  <rect A="100" B="0" C="50" D="200" fill="red"/>
						</svg>
- A = x1, B = y1, C = x2, D = y2
- A = y1, B = x1, C = y2, D = x2
- A = x, B = y, C = width, D = height
- A = y, B = x, C = height, D = width
Outline
- Design space and design trade-offs
- Graphing in the browser
- Introduction to D3
- Introduction to Vega and Vega-lite
D3
TL;DR. JavaScript library to bind data to the DOM, i.e., vocabulary of graphical marks come directly from web standards: HTML, SVG, and CSS.
To generate a graphic:
- Get the data (properly formatted as an array!)
- Use D3 to map the data to HTML elements
- Leave-it to the browser to do the rest!
Basic mechanisms to map data to HTML elements:
- Select & append
- Data join
Programming paradigms & visualization tools
| Paradigm | Imperative | Declarative |
|---|---|---|
| Properties |
|
|
| Examples | Google Charts Matplotlib WebGL |
D3 ggplot2 |
					// https://d3js.org Version 5.5.0. Copyright 2018 Mike Bostock.
					(function(t,n){"object"==typeof exports&&"undefined"!=typeof module?n(exports):"function"==typeof define&&define.amd?define(["exports"],n):n(t.d3=t.d3||{})})(this,function(t){"use strict";function n(t,n){return t<n?-1:t>n?1:t>=n?0:NaN}function e(t){return 1===t.length&&(t=function(t){return function(e,r){return n(t(e),r)}}(t)),{left:function(n,e,r,i){for(null==r&&(r=0),null==i&&(i=n.length);r<i;){var o=r+i>>>1;t(n[o],e)<0?r=o+1:i=o}return r},right:function(n,e,r,i){for(null==r&&(r=0),null==i&&(i=n.length);r<i;){var o=r+i>>>1;t(n[o],e)>0?i=o:r=o+1}return r}}}function r(t,n){return[t,n]}function i(t){return null===t?NaN:+t}function o(t,n){var e,r,o=t.length,a=0,u=-1,f=0,c=0;if(null==n)for(;++u<o;)isNaN(e=i(t[u]))||(c+=(r=e-f)*(e-(f+=r/++a)));else for(;++u<o;)isNaN(e=i(n(t[u],u,t)))||(c+=(r=e-f)*(e-(f+=r/++a)));if(a>1)return c/(a-1)}function a(t,n){var e=o(t,n);return e?Math.sqrt(e):e}function u(t,n){var e,r,i,o=t.length,a=-1;if(null==n){for(;++a<o;)if(null!=(e=t[a])&&e>=e)for(r=i=e;++a<o;)null!=(e=t[a])&&(r>e&&(r=e),i<e&&(i=e))}else for(;++a<o;)if(null!=(e=n(t[a],a,t))&&e>=e)for(r=i=e;++a<o;)null!=(e=n(t[a],a,t))&&(r>e&&(r=e),i<e&&(i=e));return[r,i]}function f(t){return function(){return t}}function c(t){return t}function s(t,n,e){t=+t,n=+n,e=(i=arguments.length)<2?(n=t,t=0,1):i<3?1:+e;for(var r=-1,i=0|Math.max(0,Math.ceil((n-t)/e)),o=new Array(i);++r<i;)o[r]=t+r*e;return o}function l(t,n,e){var r,i,o,a,u=-1;if(n=+n,t=+t,e=+e,t===n&&e>0)return[t];if((r=n<t)&&(i=t,t=n,n=i),0===(a=h(t,n,e))|...
(function() {})();About D3
- Library based on modern Web standards
- Created and maintained by Mike Bostock
- Website: https://d3js.org
- Documentation: https://github.com/d3/d3/wiki
- Gallery: https://github.com/d3/d3/wiki/Gallery
- D3 stands for Data-Driven Documents
- Concentrates on the data as opposed to the representation
- High expressiveness: good for custom/novel forms
What D3 does
- Loads data in the browser (DOES NOT HIDE THE DATA!)
- Binds data to document elements
- Transforms elements by interpreting each element’s bound datum and setting its visual properties
- Transitions elements between states in response to user input
Basic D3 operations
- Select elements
- Add new elements to selected elements
- Delete selected elements
- Modify selected elements to position and style
Basic D3 operations are implemented with Function chaining
- Function Chaining is a design pattern
- Code writtent using Function Chaining is simpler to understand:
//without chaining obj.method3(obj.method2(obj.method1())); //same var s = obj.method1(); s = s.method2(); s = s.method3(); //with chaining obj.method1() .method2() .method3(); - Function chaining is implemented using
this
:var obj = { method1: function() { console.log('method1'); return this; //this
refers to the current object instance }, method2: function(a) { console.log('method2'); return this; } }; obj.method1().method2(); method1 method2
1. Select elements
- A D3 selection is a list (or array) of nodes with a parent
select()andselectAll()return aselection- Take a CSS selector or a function as argument
					var selection = d3.select(selector);  //select first matching element in the document
					var selection = d3.selectAll(selector);  //select all matching elements in the document

					//use chaining to select on the selection object
					var selection = selection.select(selector);  //select first matching element in the selection
					var selection = selection.selectAll(selector);  //select all matching elements in the selection
					var s = d3.select('body');  //selects <body> in <html>
					s.select('p');  //selects first <p> in <body>

					d3.select('body')  //same as above using chaining
					  .select('p');

					d3.selectAll('p');  //selects all <p> in parent
					d3.select('#chart');  //selects first element in parent with id="chart"
					d3.selectAll('.red');  //selects all elements in parent with class="red"
2. Add new elements to selected elements
selection.append(type)appends a new element to the last child of each selected elementselection.insert(type[, before])inserts a new elementbeforethe first element matching the specified before selector for each selected elementselection.appendandselection.insertreturn added elements
<body></body>
					d3.select('body')
					  .append('p')  //append p as the last child of body
					  .text('Text0');  //set text to "Text0"
<body>Text0
</body>
					d3.selectAll('p')  //selects all elements of type p
					  .append('p')  //append p as the last child of the selection
					  .text('Text1');  //set text to "Text1"
<body><p>Text0<p>Text1</p></p></body>
DOM Tree of Example 2
3. Delete selected elements
- Deleting is done with a selection
selection.remove()Removes the selected elements from the document- Returns the removed elements
<body>Text0
</body>
					d3.selectAll('p')  //selects all elements of type p
					  .remove();  //removes selected elements
<body></body>
4. Modify selected elements to position and style
- Modifications are done on the selection
selection.text(text)changes the text of HTML elements elementsselection.style(style)sets the style of HTML elements elements
					Paragraph1
					Paragraph2
					d3.selectAll('p')  //select all p in document
					  .text('Paragraph');
					d3.select('p')  //select first p in document
					  .text('paragraph2');
					  .style('color', 'red');
Graphing with select and append
					<div id="chart"></div>

					<script>
					d3.select('#chart')
					  .append('div')
					  .attr('width', '300px')
					  .attr('background-color', '#eee')
					  .text('300,000');
					</script>
What will appear on the page?
						<body>
						  <p>Paragraph1</p>
						  <p>Paragraph2</p>

						  <script type="text/javascript">
						  d3.selectAll('p')
						    .text('Paragraph1');
						  d3.select('p')
						    .text('Paragraph2')
						    .style('color', 'red');
						  </script>
						</body>
Paragraph1
Paragraph2
Paragraph2$\leftarrow$
Paragraph1
Paragraph1
Paragraph2
Paragraph2
Paragraph1
What will appear on the page?
						<body>
						  <script type="text/javascript">
						    d3.select("div").text("div").style("color", "orange");
						  </script>
						</body>
- Error because text does not have the color property
- Blank page $\leftarrow$
- Error because div does not support text
- div
What will appear on the page?
						<body>
						  text
						  <script type="text/javascript">
						    d3.selectAll("p").text("p").style("color", "orange");
						  </script>
						</body>
- Error because text does not have a style property
- Blank page
- Error because p does not support text
- p $\leftarrow$
What will appear on the page?
						<body>
						  <span>Potato </span>
						  <script type="text/javascript">
						    d3.select("body").select("span").text("Tomato ");
						    d3.selectAll("span").append("span").text("Salad ");
						    d3.selectAll("span").append("span").text("Carrot ");
						  </script>
						</body>
- Potato Tomato Salad Carrot
- Tomato Salad Carrot
- Tomato Salad Carrot Carrot $\leftarrow$
- Potato
Graphing with Data Join
- Mechanism to bind data to elements in the document
- Central to D3 operations
- Works on the selection!
Data join creating 3 paragraphs and setting their text to the data
							var dataset = [0, 1, 2];

							d3.select('body')
							  .selectAll('p')
							  .data(dataset)
							  .enter()
							  .append('p')
							  .text(function(d) { return d; });
0
1
2
Data join example (1)
							var dataset = [0, 1, 2];

							d3.select('body')
							  .selectAll('p')
							  .data(dataset)
							  .enter()
							  .append('p')
							  .text(function(d) { return d; });
Data join example (2)
							var dataset = [0, 1, 2];

							d3.select('body')
							  .selectAll('p')
							  .data(dataset)
							  .enter()
							  .append('p')
							  .text(function(d) { return d; });
Data join example (3)
							var dataset = [0, 1, 2];

							d3.select('body')
							  .selectAll('p')
							  .data(dataset)
							  .enter()
							  .append('p')
							  .text(function(d) { return d; });
Data join example (4)
						var dataset = [0, 1, 2];

						d3.select('body')
						  .selectAll('p')
						  .data(dataset)
						  .enter()
						  .append('p')
						  .text(function(d) { return d; });
Data join example (5)
						var dataset = [0, 1, 2];

						d3.select('body')
						  .selectAll('p')
						  .data(dataset)
						  .enter()
						  .append('p')
						  .text(function(d) { return d; });
Data join example (6)
						var dataset = [0, 1, 2];

						d3.select('body')
						  .selectAll('p')
						  .data(dataset)
						  .enter()
						  .append('p')
						  .text(function(d) { return d; })
Data join example (7)
						var dataset = [0, 1, 2];

						d3.select('body')
						  .selectAll('p')
						  .data(dataset)
						  .enter()
						  .append('p')
						  .text(function(d) { return d; });
Configuration functions
Configurations made with functions taking datum and optional index as arguments
					var dataset = [1, 2, 3];

					d3.select('body')
					  .selectAll('p')
					  .data(dataset)
					  .enter()
					  .append('p')
					  .text(function(d, i) { return 'd=' + d + ' i=' + i; })
					  .style('color', function(d, i) { return (i % 2) ? 'red' : 'blue'; });
Data array
					var dataset = [1, 2, 3];

					d3.select('body')
					  .selectAll('p')
					  .data(dataset) //dataset must be an array!
					  .enter()
					  ...
Examples arrays that can be passed to data()
					var data = [  //array of objects
					  {name: 'A', frequency: .08167},
					  {name: 'B', frequency: .01492},
					  {name: 'C', frequency: .02780},
					  {name: 'D', frequency: .04253},
					  {name: 'E', frequency: .12702}
					];

					var data = [  //array of arrays
					  [ 0,  1,  2,  3],
					  [ 4,  5,  6,  7],
					  [ 8,  9, 10, 11],
					  [12, 13, 14, 15]
					];
What will appear on the page?
					  var dataset = ["red ", "blue ", "red ", "blue ", "red "];

					  d3.select('body').selectAll('span')
					    .data(dataset)
					    .enter()
					    .append('span')
					    .text(function (d) { return d });

					  d3.selectAll("span")
					    .style("text-decoration", function (d, i) { return (i % 2) ? "none" : "underline"; })
					    .append("span").text("blue ");
- red blue red blue red
- red blue red blue red
- red blue blue blue red blue blue blue red blue$\leftarrow$
- red blue blue blue red blue blue blue red blue
What will appear on the page?
						<body>
						<script type="text/javascript">
						  var dataset = ['red ', 'blue ', 'red ', 'blue ', 'red '];

						  d3.select('body')
						    .selectAll('span')
						    .data(dataset)
						    .enter()
						    .append('span')
						    .text(function (d) { return d });

						  d3.selectAll("span")
						    .style("text-decoration", "underline");

						  dataset = shuffle(dataset);
						  d3.select('body')
						    .selectAll('span')
						    .data(dataset)
						    .enter()
						    .append('span')
						    .text(function (d) { return d });

						  d3.selectAll("span")
						    .style("text-decoration", "none");

						  function shuffle(array) {  // Shuffles array.
						    var m = array.length, t, i;
						    while (m) {
						      i = Math.floor(Math.random() * m--);
						      t = array[m], array[m] = array[i], array[i] = t;
						    }
						    return array;
						  }
						</script>
						</body>
- red blue red blue red
- red blue red blue red$\leftarrow$
- red blue red blue red red blue red blue red
- red blue red blue red red blue red blue red
Outline
- Design space and design trade-offs
- Graphing in the browser
- Introduction to D3
- Introduction to Vega and Vega-lite
VEGA
TL;DR. Graphic & data described as JSON (spec)
To generate a graphic:
- Write a Vega or Vega-lite spec
- Use a Javascript library (vegaEmbed) to render the spec
Example Vega bar chart
VEGA-LITE
- High-level visualization grammar in a concise JSON syntax
- Support interactive multi-view graphics
- Compiles to Vega
						{
						  "$schema": "https://vega.github.io/schema/vega-lite/v3.json",
						  "description": "A simple bar chart with embedded data.",
						  "data": {
						    "values": [
							  {"a": "A","b": 28},
							  {"a": "B","b": 55},
							  {"a": "C","b": 43},
							  {"a": "D","b": 91},
							  {"a": "E","b": 81},
							  {"a": "F","b": 53},
							  {"a": "G","b": 19},
							  {"a": "H","b": 87}
						    ]
						  },
						  "mark": "bar",
						  "encoding": {
						    "x": {"field": "a", "type": "ordinal"},
						    "y": {"field": "b", "type": "quantitative"}
						  }
						}
VEGA
- Visualization grammar
- Describes the appearance and interactive behavior of a visualization in JSON
							{
							  "$schema": "https://vega.github.io/schema/vega/v4.json",
							  "width": 400,
							  "height": 200,
							  "padding": 5,

							  "data": [
							    {
							      "name": "table",
							      "values": [
							        {"category": "A", "amount": 28},
							        {"category": "B", "amount": 55},
							        {"category": "C", "amount": 43},
							        {"category": "D", "amount": 91},
							        {"category": "E", "amount": 81},
							        {"category": "F", "amount": 53},
							        {"category": "G", "amount": 19},
							        {"category": "H", "amount": 87}
							      ]
							    }
							  ],

							  "signals": [
							    {
							      "name": "tooltip",
							      "value": {},
							      "on": [
							        {"events": "rect:mouseover", "update": "datum"},
							        {"events": "rect:mouseout",  "update": "{}"}
							      ]
							    }
							  ],

							  "scales": [
							    {
							      "name": "xscale",
							      "type": "band",
							      "domain": {"data": "table", "field": "category"},
							      "range": "width",
							      "padding": 0.05,
							      "round": true
							    },
							    {
							      "name": "yscale",
							      "domain": {"data": "table", "field": "amount"},
							      "nice": true,
							      "range": "height"
							    }
							  ],

							  "axes": [
							    { "orient": "bottom", "scale": "xscale" },
							    { "orient": "left", "scale": "yscale" }
							  ],

							  "marks": [
							    {
							      "type": "rect",
							      "from": {"data":"table"},
							      "encode": {
							        "enter": {
							          "x": {"scale": "xscale", "field": "category"},
							          "width": {"scale": "xscale", "band": 1},
							          "y": {"scale": "yscale", "field": "amount"},
							          "y2": {"scale": "yscale", "value": 0}
							        },
							        "update": {
							          "fill": {"value": "steelblue"}
							        },
							        "hover": {
							          "fill": {"value": "red"}
							        }
							      }
							    },
							    {
							      "type": "text",
							      "encode": {
							        "enter": {
							          "align": {"value": "center"},
							          "baseline": {"value": "bottom"},
							          "fill": {"value": "#333"}
							        },
							        "update": {
							          "x": {"scale": "xscale", "signal": "tooltip.category", "band": 0.5},
							          "y": {"scale": "yscale", "signal": "tooltip.amount", "offset": -2},
							          "text": {"signal": "tooltip.amount"},
							          "fillOpacity": [
							            {"test": "datum === tooltip", "value": 0},
							            {"value": 1}
							          ]
							        }
							      }
							    }
							  ]
							}